Isolation Forest
This operator applies the Isolation Forest unsupervised outlier detection algorithm to the input data set. The implementation of the Isolation Forest algorithm is provided by the open-source library from LinkedIn.
Information at a Glance
|
Parameter |
Description |
|---|---|
| Category | Model |
| Data source type | TIBCO® Data Virtualization |
| Send output to other operators | Yes |
| Data processing tool | TIBCO® DV, Apache Spark 3.2 or later |
Algorithm
An Isolation Forest is an unsupervised learning algorithm for anomaly detection that isolates the potential anomalies in a data set. Isolation Forest is built on an ensemble of decision trees. The algorithm builds each tree with randomly selected features and samples. In principle, the most different observations are partitioned with fewer splits and are closer to the root. Thus, the path length is defined as the measure of normality, and the anomaly score returned by the algorithm is calculated with the function of inverse average path length over a forest of decision trees.
The columns specified are used to train the isolation anomaly detection model and the selected categorical columns are featured by a one-hot encoding algorithm.
Input
An input is a single tabular data set.
Generating an integer timestamp (For example, the number of seconds since 1 January 1970)
Extracting for example, day of month, month, year wherever appropriate
Configuration
The following table provides the configuration details for the Isolation Forest operator.
| Parameter | Description |
|---|---|
| Notes | Notes or helpful information about this operator's parameter settings. When you enter content in the Notes field, a yellow asterisk appears on the operator. |
| Use all available columns as Predictors | When set to Yes, the operator uses all the available columns as predictors and ignores the Continuous Predictors and Categorical Predictors parameters. When set to No, the user must select at least one of the Continuous or Categorical Predictors. |
| Continuous Predictors | Specify the numerical data columns as independent columns. It must be a numerical column. Click Select Columns to select the required columns. Note: The columns selected in the Categorical Predictors parameter are not available. |
| Categorical Predictors | Specify the categorical data columns as independent columns. Click Select Columns to select the required columns. Note: The columns selected in the Continuous Predictors parameter are not available. |
| Number of Estimators | Specify the number of trees or estimators. Default: 100 |
| Apply Bootstrap | Specify whether to sample each tree with replacement. If Yes, draw a sample for each tree with replacement. If No, do not sample with replacement. Default: No |
| Fraction/ Number of Samples | Specify the number of samples used to train each tree. If the value is between 0.0 and 1.0, it is treated as a fraction. If the value is more than 1.0, it is treated as a count. Default: 1.0 |
| Fraction/ Number of Features | Specify the number of features used to train each tree. If the value is between 0.0 and 1.0, it is treated as a fraction. If the value is more than 1.0, it is treated as a count. Default: 1.0 |
| Contamination | Specify the fraction of outliers in the training data set. If the value is set to 0.0, it speeds up the training and all predicted labels are false. The model and outlier scores are otherwise unaffected by this parameter.
Default: 0.1 |
|
Contamination Error (Advanced) |
The acceptable error when calculating the threshold required to achieve the specified contamination fraction. When the value is 0.0, it forces an exact calculation of the threshold. The exact calculation is slow and can fail for large data sets. If there are issues with the exact calculation, a good choice for this parameter is often 1% of the specified contamination value.
Default: 1.0E-4 |
| Random Seed | Specify the seed used for the pseudo-random row extraction. Default: 1 |
Output
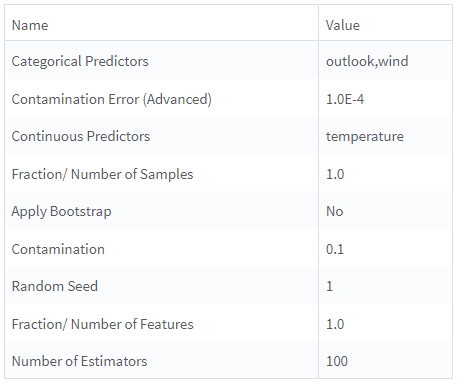
- Parameters Summary Info: Displays information about the input parameters and their current settings.
-
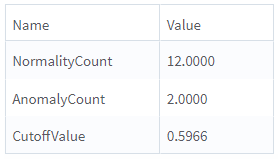
Training Summary: Displays a table containing the data for normality count, anomaly count, and cutoff value.
The cutoff value is the outlier score threshold or the minimum score of the anomalous observations. The observations with outlier scores greater than the cutoff value are considered anomalous.
-
PRED_ISF: Specifies whether an observation is an anomaly. If the value is 1, it is an anomaly and if the value is 0, it is not an anomaly.
-
CONF_ISF: Returns the anomaly score.
Example
The following example demonstrates the Isolation Forest operator.

- Multiple columns namely outlook, temperature, wind, humidity, and play.
- Multiple rows (14 rows).
-
Use all available columns as Predictors: No
-
Continuous Predictors: temperature
-
Categorical Predictors: outlook, wind
-
Number of Estimators: 100
-
Apply Bootstrap: No
-
Fraction/ Number of Samples: 1.0
-
Fraction/ Number of Features: 1.0
-
Contamination: 0.1
-
Contamination Error (Advanced): 1.0E-4
-
Random Seed: 1.0

