Home > Oracle Essbase > Using the Data Panel with Oracle Essbase Data
The Data panel is used to get an overview of the columns in all data tables, in-memory as well as in-database (in-db). When working with in-database data the Data panel is the starting point for configuring both visualizations and the filters panel, since no filters are created automatically for external data. Depending on the data source, there will be different sections available for a selected data table.
Oracle Essbase Data
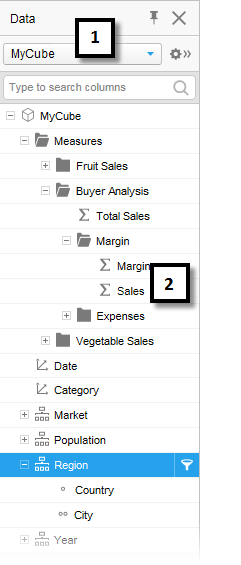
When you are working with Oracle Essbase data, the Data panel will look something like this:
Number |
Section |
Description |
1 |
Data table selector |
[Only available if more than one data table have been added to the analysis.] Lists all data tables in the analysis. Choose a different data table to view the columns in that data table instead. (The expanded data panel does not support cube data sources.) |
2 |
Source structure |
If the data is shown with a hierarchical structure, the underlying structure of the data source is shown here. Top levels can be expanded to reveal, for example, the different levels in a hierarchy. It is recommended to use the hierarchical view when working with cube data, to avoid mixing unrelated columns in one visualization. |
Note: When working with in-db cube data it is not possible to create filters for measures or sets, only for dimension columns. This is because the cube calculates the measures in the context of the selected dimensions.
See also:
Details on Oracle Essbase Connection