Services
The Services dashboard shows details of the total number of hits for a service, their trend, successful responses from the service, faults encountered by the service, and so on.
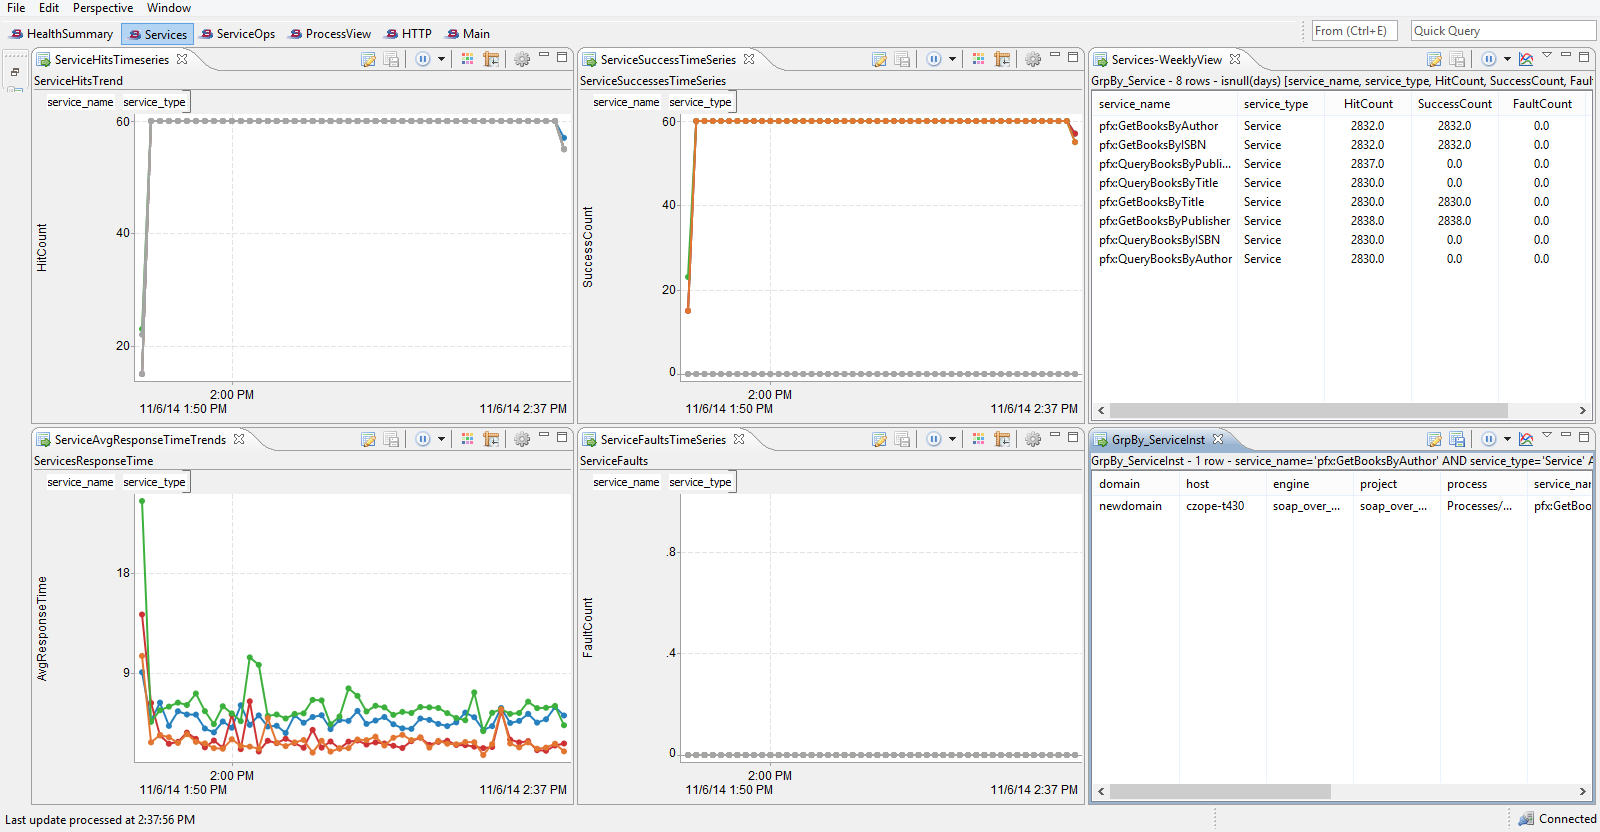
The Services dashboard shows the following graphs and tables:
- ServiceHitsTrend: shows the trend of the total number of hits for the service
- ServiceSuccessTimeSeries: shows the time series chart of the number of successful responses for the service
- ServiceResponseTimeTrends: shows the trend of the average response time of the service
- ServiceFaultsTimeSeries: shows the time series chart of the number of faults encountered by the service
- Services-WeeklyView: shows the weekly view of the service
- GrpBy_ServiceInst: shows the services grouped by service instances
Copyright © Cloud Software Group, Inc. All Rights Reserved.