Service Operations
The Service Operations dashboard shows details of the total number of hits for a service operation, their trend, successful responses from the service operation, faults encountered by the service operation, and so on.
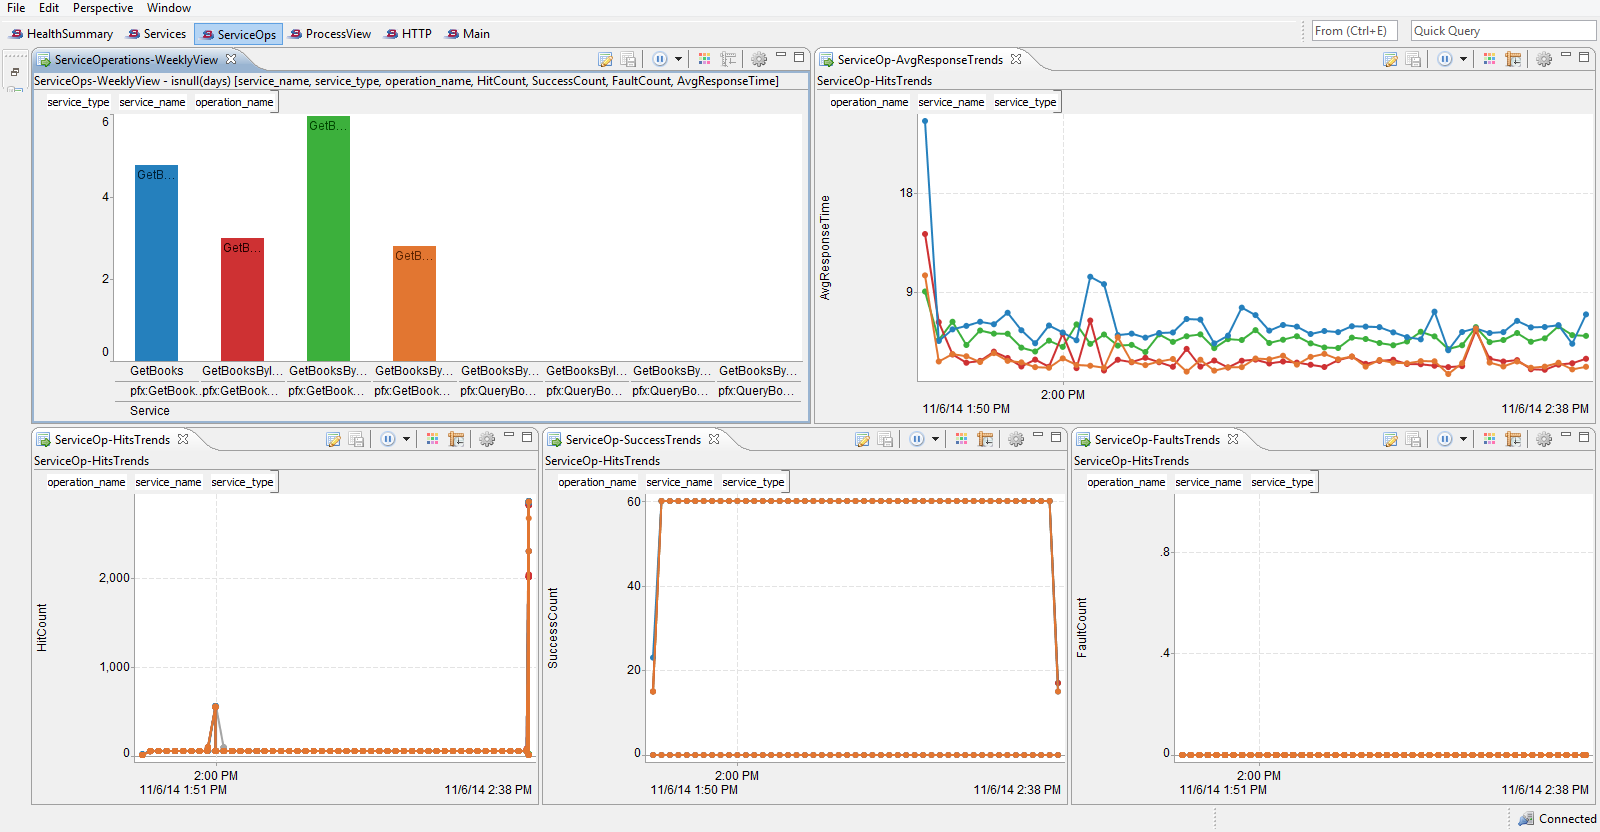
The Service Operations dashboard shows the following graphs and tables:
- ServiceOperations-WeeklyView: shows the weekly view of the service operations
- ServiceOp-AvgResponseTrends: shows the trend of the average response time of the service operation
- ServiceOp-HitsTrend: shows the trend of the total number of hits for the service operation
- ServiceOp-SuccessTrends: shows the trends of the number of successful responses for the service operation
- ServiceOp-FaultsTrends: shows the trends of the number of faults encountered by the service operation
Copyright © Cloud Software Group, Inc. All Rights Reserved.