Health Summary
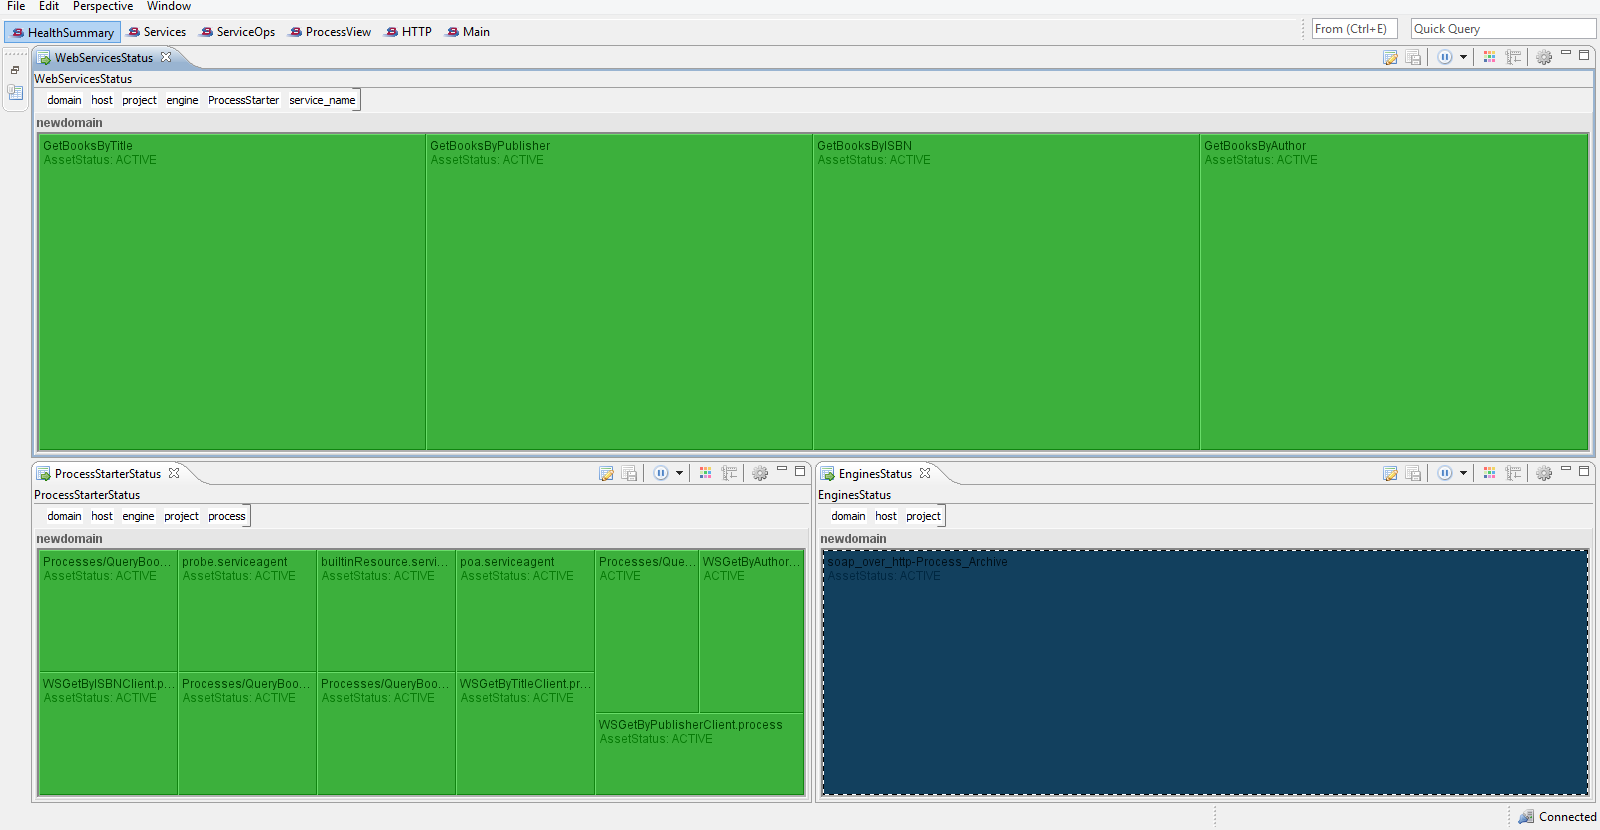
By default, the Health Summary dashboard shows the status of the web services, process starters, and engines.
The WebServiceStatus pane shows the status (active/inactive) of the services in a heat map. For the exact status of a service, you can select the domain, host, project, engine, process starter, and service name in the pickers above the heatmap. The ProcessStarterStatus pane shows the status (active/inactive) of the process starters in a heat map. For the exact status of a process starter, you can select the domain, host, engine, project, and process in the pickers above the heatmap. The EngineStatus pane shows the status (active/inactive) of the engines in a heat map. You can see the exact status of the engines by selecting the domain, host, and project from the pickers above the heatmap.
Copyright © Cloud Software Group, Inc. All Rights Reserved.