Shared Resources
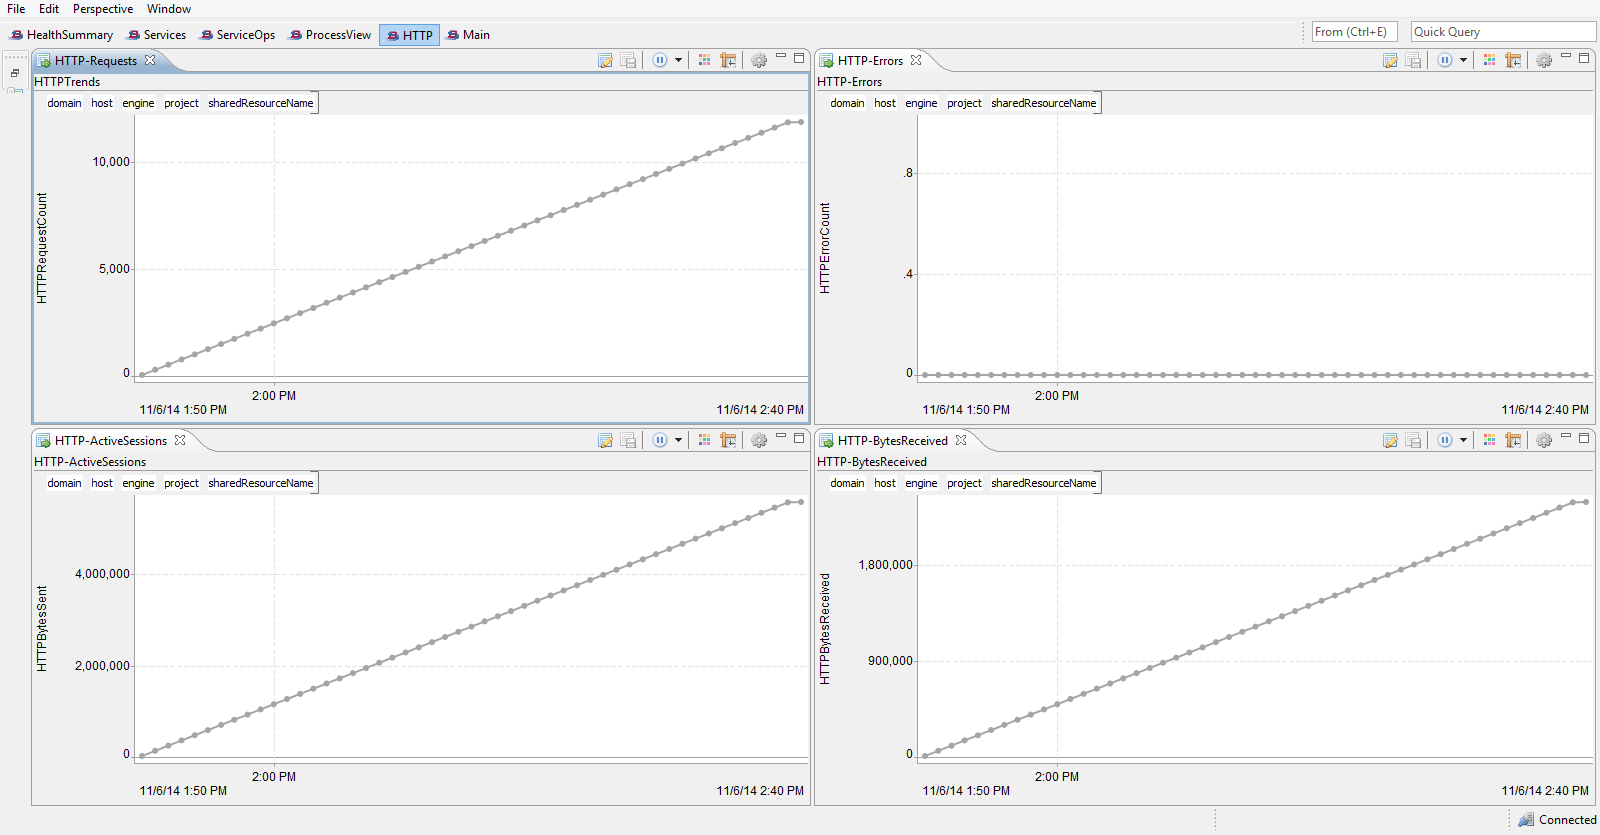
The shared resources dashboard shows details of the HTTP or JDBC requests, such as the trend of the total requests, active sessions, errors, and request bytes.
The shared resource dashboard shows the following graphs:
- HTTP/JDBC Requests: shows the trend of the total HTTP/JDBC requests. You can filter them by selecting the domain, host, engine, project, and shared resource name from the pickers above the graph.
- HTTP/JDBC ActiveSessions: shows the trend of the HTTP/JDBC bytes sent in a session. You can filter them by selecting the domain, host, engine, project, and shared resource name from the pickers above the graph.
- HTTP/JDBC Errors: shows the trend of HTTP/JDBC errors. You can filter them by selecting the domain, host, engine, project, and shared resource name from the pickers above the graph.
- HTTP/JDBC BytesReceived: shows the total number of HTTP/JDBC bytes received. You can filter them by selecting the domain, host, engine, project, and shared resource name from the pickers above the graph.
Copyright © Cloud Software Group, Inc. All Rights Reserved.