LiveView Dashboards for ActiveMatrix BusinessWorks 6.x
LiveView Desktop shows various dashboards for the ActiveMatrix BusinessWorks 6.x environment. These dashboards use the aggregated data processed by the SPM agent for ActiveMatrix BusinessWorks 6.x.
See Assets Monitored for ActiveMatrix BusinessWorks 6.x for more details on the assets monitored, measurement criteria used, and grouping hierarchies for the data.
The following sections show the default dashboards in the LiveView Desktop for ActiveMatrix BusinessWorks 6.x. You can configure the dashboards to display the data as per your requirement.
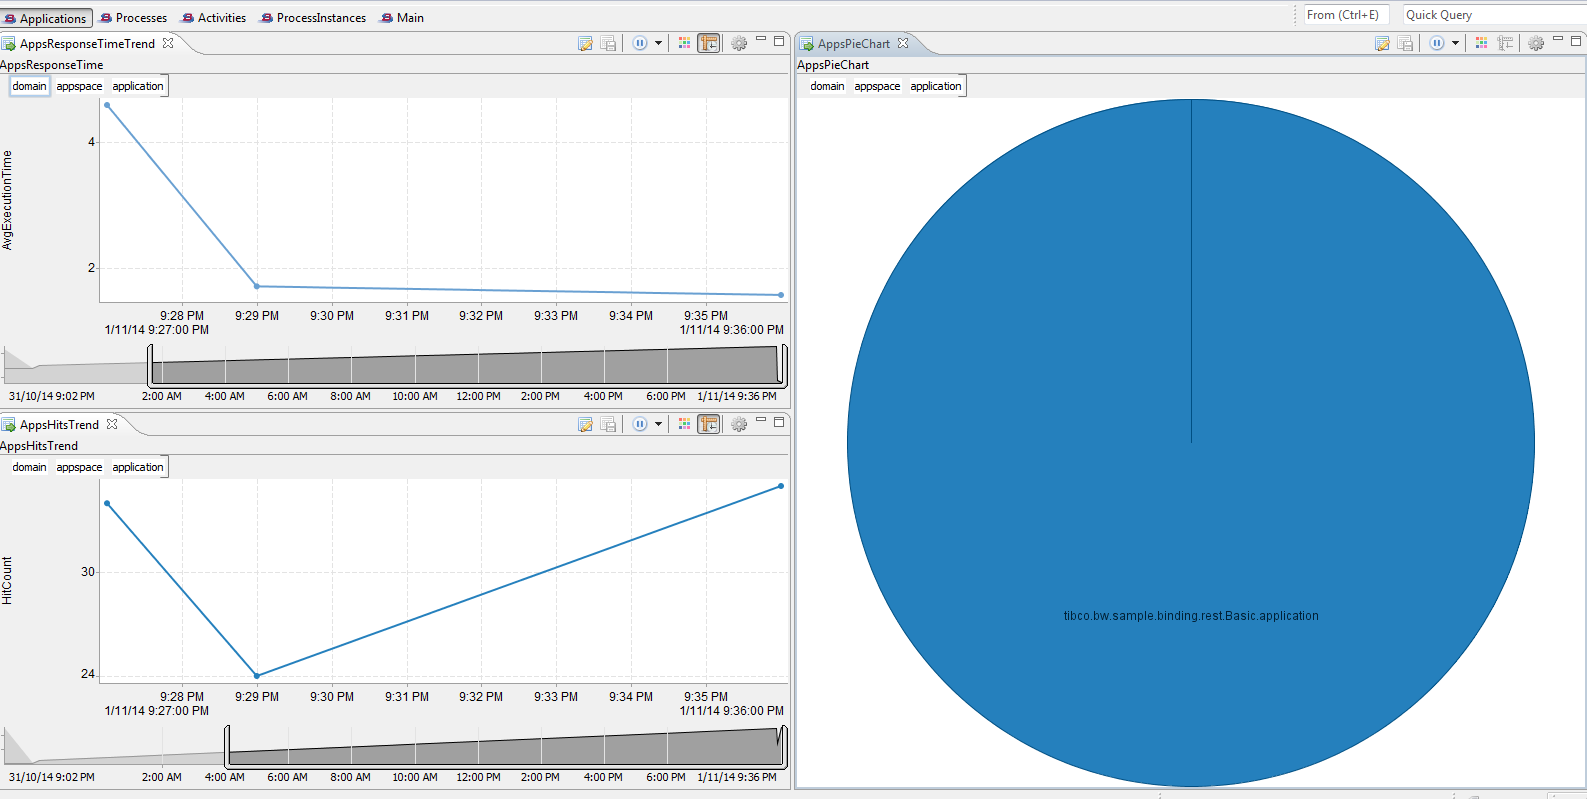
Applications
By default, the Applications dashboard shows trend for average execution time, hit count, and total hits for each application. For the exact status of a application, you can select the domain, appspace, and application in the pickers above the charts.
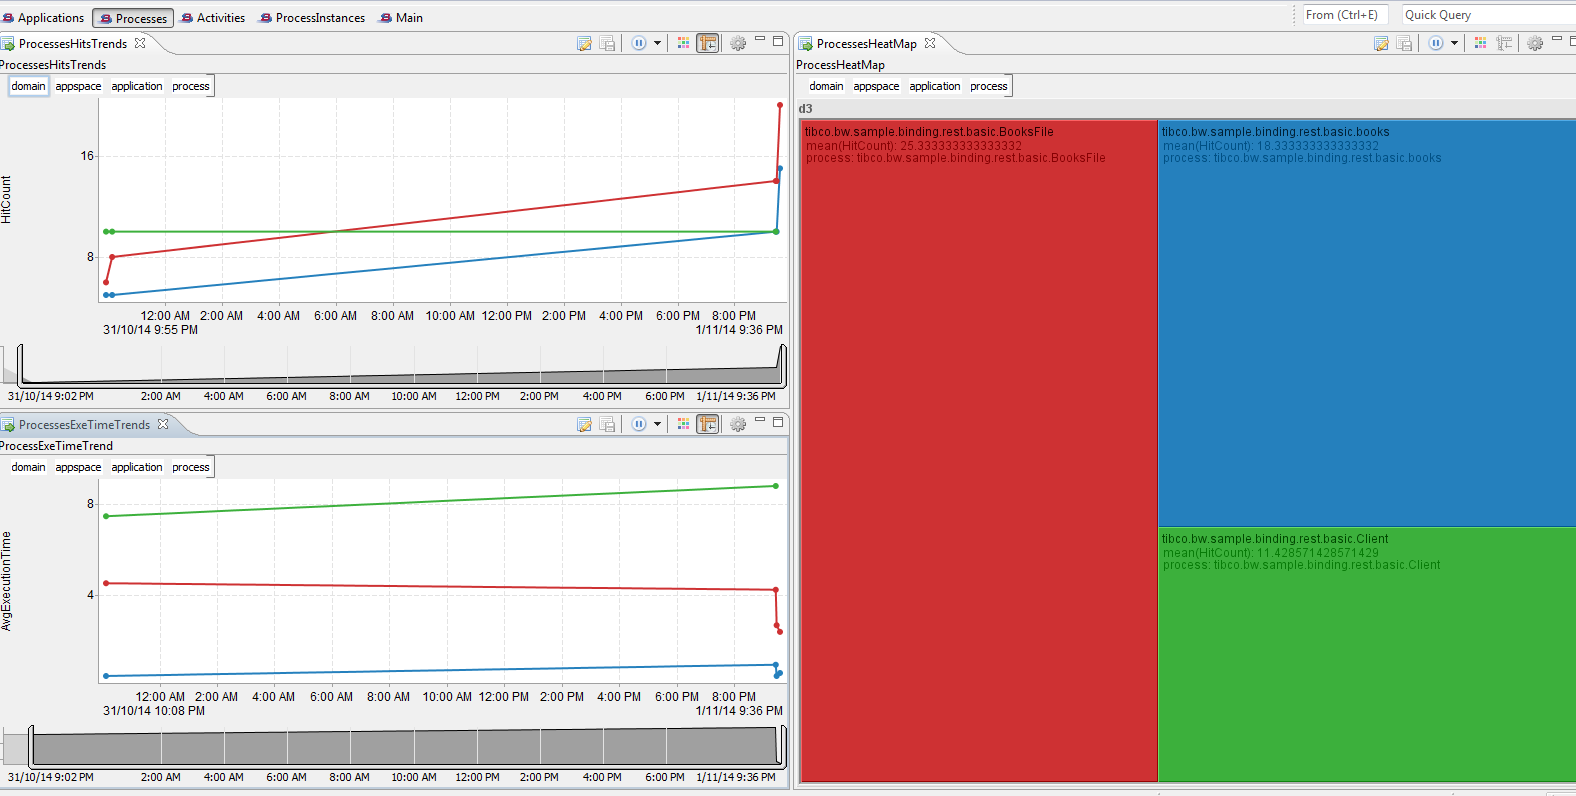
Processes
By default, the Processes dashboard shows trend for average execution time, hit count, and total hits (as a heatmap) for each process. For the exact status of a process, you can select the domain, appspace, application, and process in the pickers above the charts and heatmaps.
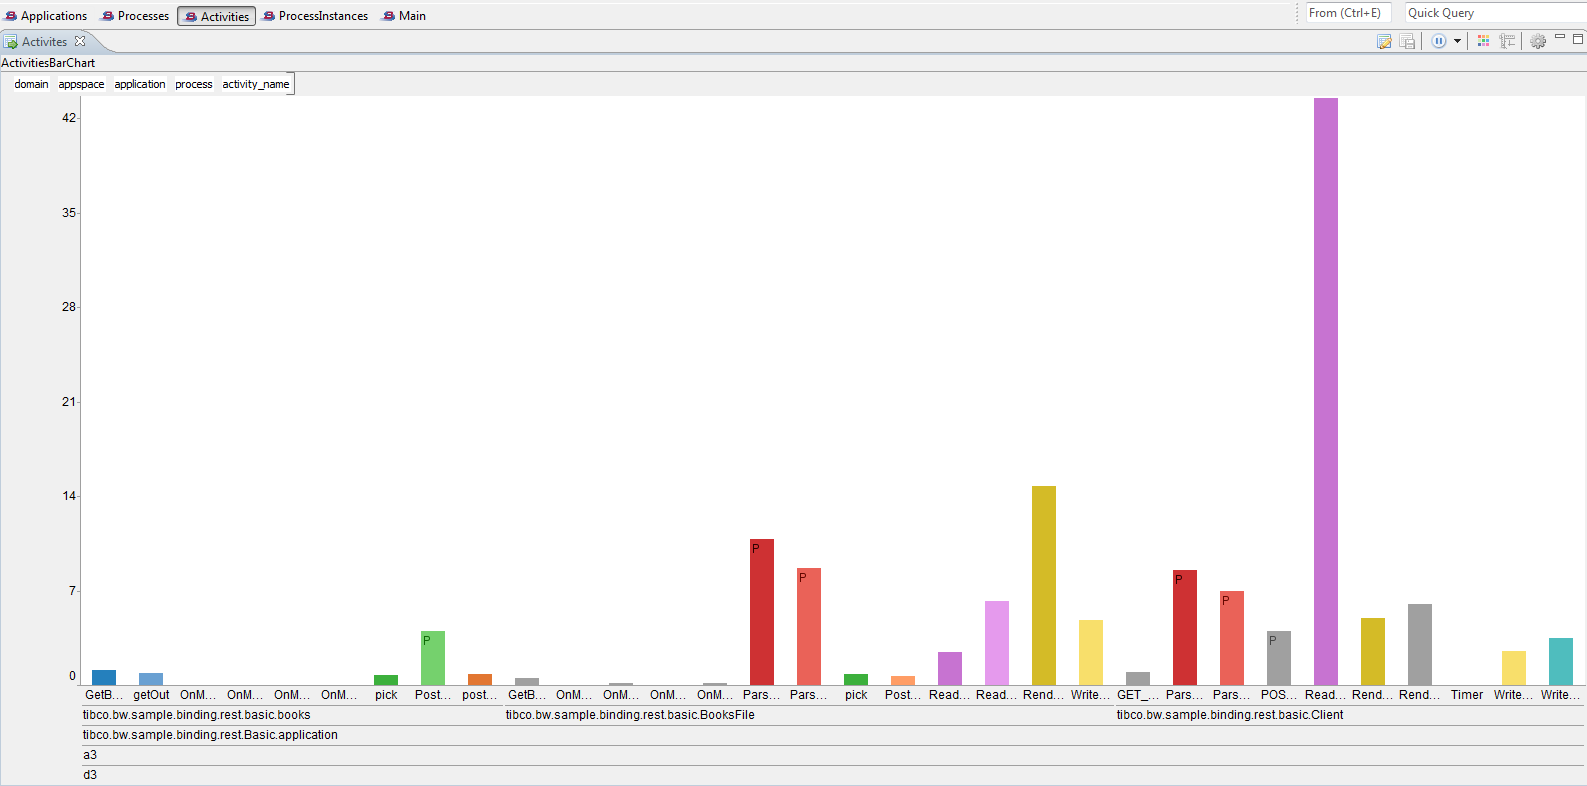
Activities
By default, the Activities dashboard shows average execution time for each activity. For the exact status of a activity, you can select the domain, appspace, application, process, and activity_name in the pickers above the chart.
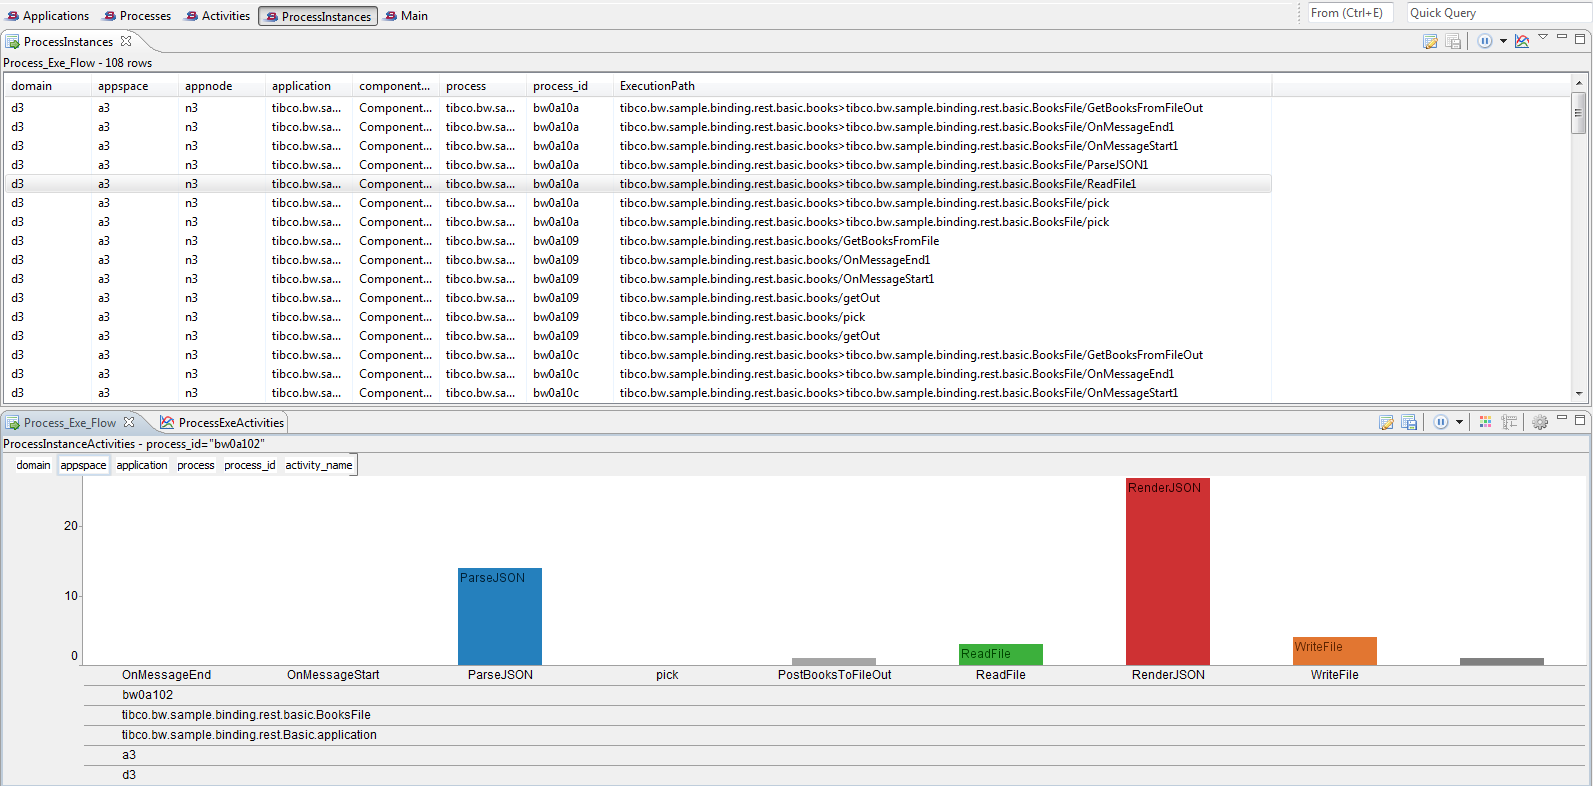
ProcessInstances
By default, the ProcessInstances dashboard lists all the process instances and activities associated with each process instances. For the exact status of a process instance, you can select the domain, appspace, application, process, process_id, and activity_name in the pickers above the charts.
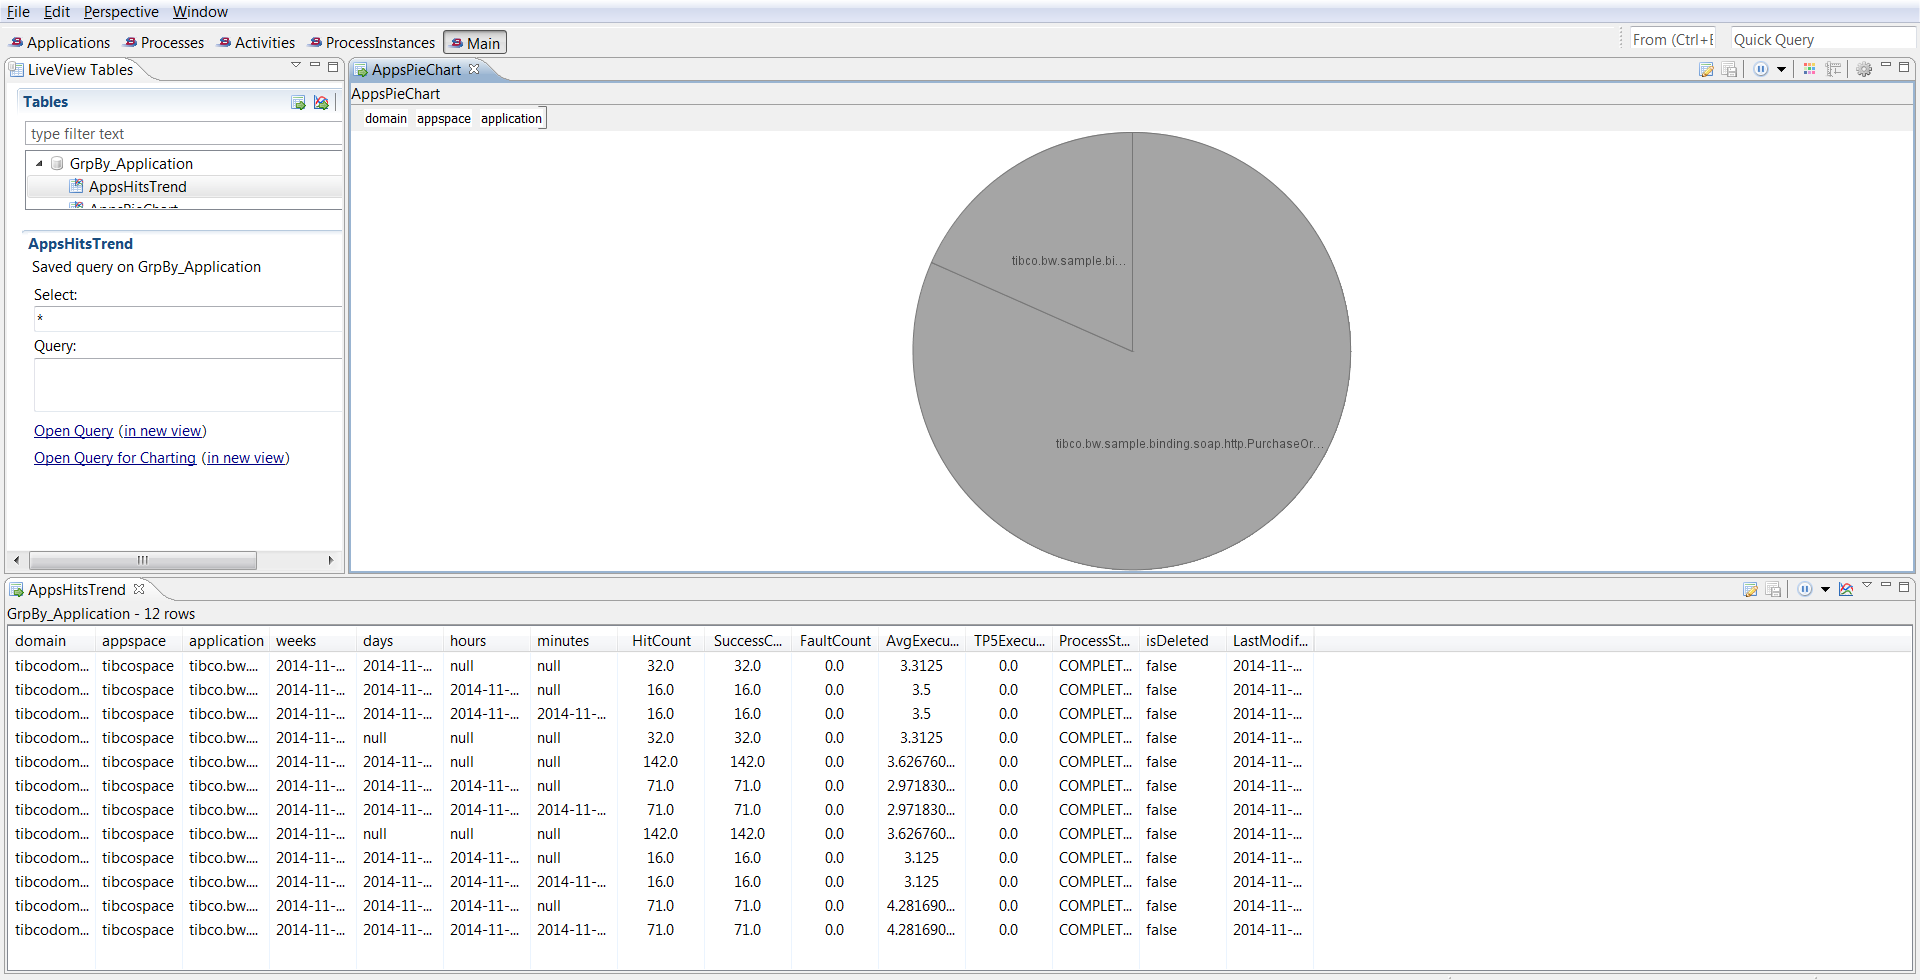
Main Dashboard
The main dashboard displays details of the selected LiveView tables.
The TIBCO Service Performance Manager hierarchy tables contain aggregated data across dimensions. The aggregated data are measurements calculated across time dimensions. Selecting a LiveView table from the left pane displays the details of that table in the bottom pane.
For detailed information on querying, refer to the TIBCO StreamBase LiveView documentation.