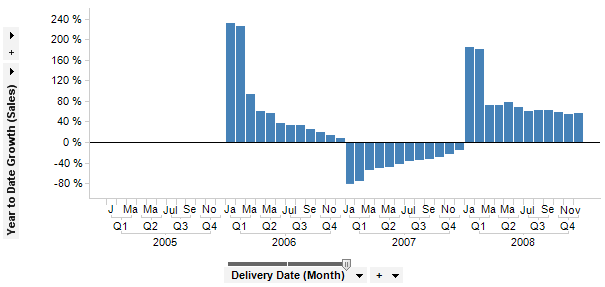
Shows the relative difference between the cumulative sums for consecutive years. This aggregation is only applicable when you are having a time hierarchy including year on the X-axis.
Example:
Expression:
Sum([Sales]) THEN Sum([Value]) OVER (Intersect(AllPrevious([Axis.X]),NavigatePeriod([Axis.X],"Year",0,0))) THEN ([Value] / First([Value]) OVER (NavigatePeriod([Axis.X],"Year",-1))) - 1
The first part of the expression calculates the values to compare, i.e., the sum of sales in this example. After the first THEN keyword comes the calculation to be done on the selected nodes: the sum of all previous nodes for each year. After the second THEN is the percentage calculation which calculates how large the increase or decrease of the cumulative sum was compared to the last year: the sum of the nodes within this year divided by the sum of the nodes for the previous year and 1 is subtracted to get the percentage.
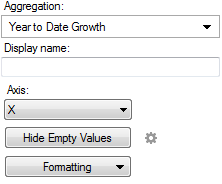
Column Selector Controls in Expanded Mode:
Option |
Description |
Aggregation |
This is where you select the Year to Date Growth aggregation. |
Display name |
Allows you to specify a different display name, instead of the default "Year to Date Growth ([Column Name])". |
Axis |
Allows you to specify the axis over which to calculate the nodes. Only categorical axes that perform some kind of grouping can show up in the drop-down list. This means that if you only have a grouping on the X-axis then this is the only axis available, whereas if you also have colored by a categorical column then the Color axis will be available as well, and so on. |
Hide Empty Values |
Creates
a Show/Hide
Items rule that hides all empty values. Click on the properties
symbol, |
Formatting |
Allows you to change the formatting of the axis. For example, change to Percentage to show the values in percent rather than as decimal numbers. |
See also:
Using Expressions on Aggregated Data (the THEN Keyword
 , to go to the Show/Hide Items page
of the Visualization Properties dialog to edit or remove the rule.
, to go to the Show/Hide Items page
of the Visualization Properties dialog to edit or remove the rule.