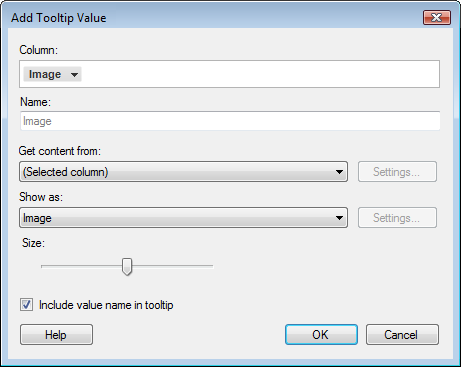
Use these dialogs to choose additional values to be displayed in the tooltips for the active visualization.
To reach the Add/Edit Tooltip Value dialog:
In the Visualization Properties dialog, go to the Tooltip page.
Click on the Add... button to add a tooltip value. To edit a tooltip value, select the value of interest from the list, then click on Edit.... Only the tooltip values that you have added to the list yourself can be edited or deleted.
Note: Adding/editing
tooltip values is not applicable to table visualizations.
Note: When adding tooltip values to a box
plot, the custom tooltip values are only displayed for outliers, not
for the boxes.

Option |
Description |
Column |
Select the column or expression you wish to be visible in the tooltip. |
Name |
Type a name to be presented with the value in the tooltip. The column or expression selected above will be used as a default name if nothing else is entered. (To exclude the name completely from the tooltip, clear the Include value name in tooltip check box below instead.) |
Get
content from |
[Only visible if at least one virtual column producer is available.] Your company may have set up some type of virtual column producers that can take the values from the selected column and transform them in one way or another to produce a desired output. For example, if you have access to TIBCO Spotfire Lead Discovery you can select Structure Column here, in order to show molecular structures from an information link in the labels. For embedded images in the current data table, or when fetching data via a URL, you should leave this setting at (Selected column). |
Settings... |
If the selected source has some settings available, you can reach those by clicking on the Settings button. For example, this is where you would specify which information link to retrieve structures from when using TIBCO Spotfire Lead Discovery. |
Show
as |
Allows you to select how the data in the selected column should be interpreted. For example, use Text for plain text labels. Use Image if there are binary images in your data that you want to use as labels. Use Link if the text should be interpreted as a web link. Use Image from URL if the image is picked from a web resource location. You may need to change the Link or Image from URL Renderer Settings by clicking on the Settings... button and modifying the link syntax so that it fits your current data. Use Geometry if your data is a shape file and you want to show the geometrical shapes in the labels. If a TIBCO Spotfire Lead Discovery structure column is used to label by, then you would select a renderer for displaying structure images here. |
Settings... |
If the selected Show as method has some settings available that can be modified, you can reach them by clicking on the Settings button. For example, this could be Link Renderer Settings or Image from URL Renderer Settings for a web link, Geometry Renderer Settings or some structure renderer settings. |
Size |
Available if the selected tooltip value is some kind of image. Increases or decreases the size of the image. |
Include
value name in tooltip |
Select this check box if you do want to include the name of the selected value along with the value itself. Clear the check box to show the resulting value only (for example, an image). |
See also:
Highlighting in Visualizations