Option |
Description |
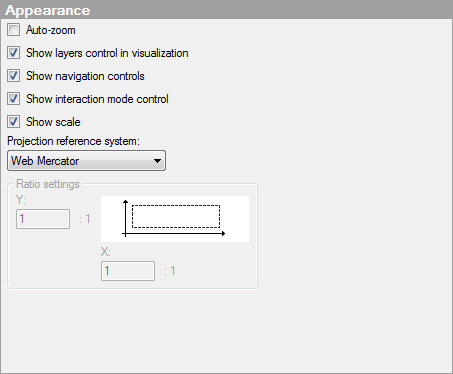
Auto-zoom |
If the check box is selected, the visualization is automatically zoomed in on the filtered markers or shapes. Each layer in the map chart (except the map layers) can be specified to be "Included in auto-zoom" or not, depending on whether the data or image should be taken into account or not. When using auto-zoom together with subsets and trellising, all trellis panels are taken into account, there is no individual zoom per panel. Note: To be able to zoom and pan using the navigation controls or keyboard shortcuts, Auto-zoom must be deselected. |
Shows or hides the layers control:
The layers control can be useful for getting an overview of the different layers in a visualization. You can show or hide layers and also switch the interactive layer. |
|
Show
navigation controls |
Shows or hides the navigation controls:
The navigation controls are used to zoom or pan in the map. |
Show
interaction mode control |
Shows or hides the interaction mode control:
The interaction mode control allows you to switch between the mode where you can mark items and the mode where you can pan the map by clicking and dragging the map. |
Show
scale |
Shows or hides the scale at the bottom left part of the map:
|
Projection
reference system |
Allows you to specify whether the projection reference system should be Web Mercator, which is the system used for displaying web-based maps, or None, which is used for displaying your own image backgrounds. Note that not all coordinate reference systems in the layers can be used with all projection reference systems in the map chart. Generally, the projection reference system None is only used together with a coordinate reference system set to None, when you want to display markers on an image. |
Ratio
settings |
[Only applicable when the Projection reference system is set to "None".] Allows you to specify the ratio of data values on the imaginary X- and Y-axes to spread values better on top of an image. By changing the ratio you can stretch the data range so that markers are evenly distributed over an area even if the actual values on the axes are of different dimensions. For example, if your X-values range from 0 to 10 and your Y-values range from 0 to 100, you can set the Y ratio to 10:1 for an even distribution of values. |
Y |
Sets the ratio of the Y-values. |
X |
Sets the ratio of the X-values. |
See also:


