Option |
Description |
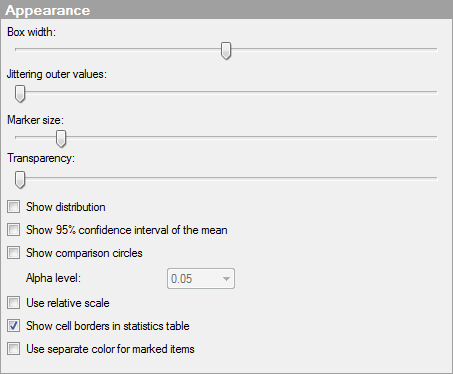
Box
width |
Specifies the width of all box plots. |
Jittering
outer values |
Displaces outside values and far out values to reveal overlapping. Move the slider to change the level of jittering. |
Marker
size |
Specifies the size of all outer values. |
Transparency |
Drag the slider to change the transparency in the box plot. This can be useful if you want to be able to see lines or curves placed in the background. |
Show
distribution |
Specifies whether or not the distribution of values should be shown as a histogram:
|
Show
95% confidence interval of the mean |
Select the check box to display the confidence interval in the box plot as a black line next to the box. |
Show
comparison circles |
Select the check box to display comparison circles in the box plot visualization. See What are Comparison Circles? for more information. |
Alpha
level |
The level at which the difference between groups would be significant. |
Use
relative scale |
Sets the max and the min for all box plots to 100% and 0%, respectively. |
Show
cell borders in statistics table |
Specifies whether or not cell borders should be visible in the statistics table. |
Use
separate color for marked items |
Select this check box to use the specified marking color to distinguish marked items in this visualization. If the check box is cleared, then unmarked items will be faded out instead, and the original color will be kept for the marked items. See Marking in Visualizations for more information. |
See also: