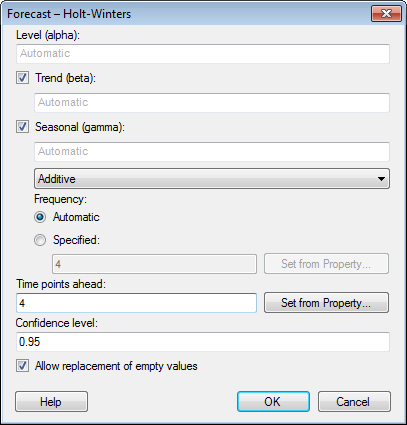
This dialog is shown when you add or edit a Holt-Winters forecast from the Lines & Curves page of the Visualization Properties dialog (only available for some visualization types).
Option |
Description |
Level
(alpha) |
Specifies how to smooth the level component of the time series. The level (alpha) parameter must be larger than 0 but not larger than 1. A small value means that older values in the X direction are weighted more heavily. Values near 1.0 mean that the latest value has more weight. Leave the field blank to let the Holt-Winters function automatically find the optimal value of alpha. |
Trend
(beta) |
Specifies how to smooth the trend component of the time series. The trend (beta) parameter must be in the interval of 0-1. A small value means that older values in X direction are weighted more heavily. Values near 1.0 mean that the latest value has more weight. Leave the field blank to let the Holt-Winters function automatically find the optimal value of beta. |
Seasonal (gamma) |
Specifies how to smooth the seasonal component of the time series. The seasonal (gamma) parameter must be in the interval of 0-1. A small value means that older values in X direction are weighted more heavily. Values near 1.0 mean that the latest value has more weight. Leave the field blank to let the Holt-Winters function automatically find the optimal value of gamma. Use the drop-down list to specify how the seasonal component should interact with the other components: Additive (default) indicates that X is modeled as level + trend + seasonal. Multiplicative indicates the model is (level + trend) * seasonal. |
Frequency |
[Only applicable when a Seasonal (gamma) component is included in the model.] Specifies the number of seasonal periods to use to compute start values, that is, the number of observations per sampling period. For example, monthly data have a frequency of 12. The frequency must be greater than 1 to fit a seasonal component. |
Automatic |
Use this option to set the frequency automatically. |
Specified |
Use this option to specify a frequency, either using a fixed number or by using a property value, see below. |
Set
from Property... |
Opens the Set from Property dialog where you can add a property value to set the frequency value. The property value can in turn be changed by adding a property control in a text area. See Using Properties in the Analysis for more information. |
Time
points ahead |
Specifies the number of time points (nodes) into the future at which to predict the values of the time series. If the visualization shows months, then the time points ahead equals the number of months forward to predict. If the visualization shows years, then the time points ahead represents the number of years forward to predict. |
Set
from Property... |
Opens the Set from Property dialog where you can add a property value to set the time points ahead value. The property value can in turn be changed by adding a property control in a text area. See Using Properties in the Analysis for more information. |
Confidence
level |
Specifies the confidence level. This should be a number larger than 0 but not larger than 1. |
Allow
replacement of empty values |
Allows you to replace empty values by interpolating the adjacent values. Note that two missing data points in a row cannot be interpolated. |
Leaving the curve parameter fields blank will let the application automatically create curve parameter values based on the currently used data.
Note that if you specify curve parameters that are very far away from the data values, no curve will be drawn.
See also: