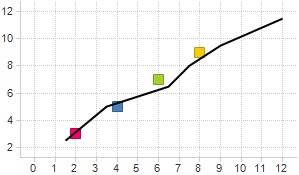
Use this alternative if you want to display lines based on X and Y coordinates that already exist in two columns of your analysis. For example, coordinate values could be calculated from the input data using a statistical calculation in a data function and the output result could be presented as coordinate values for a curve.
When the line is drawn from column values it is also possible to show predictive values, if these are available:
Note that lines cannot be drawn when categorical scales are used on the axes.
Option |
Description |
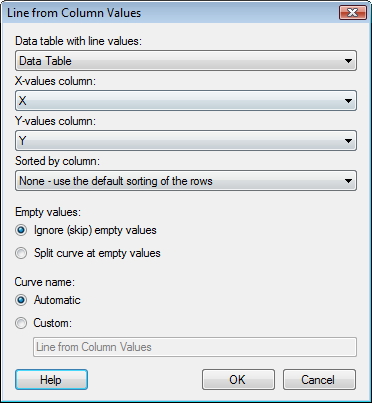
Data
table with line values |
Lists the available data tables in the analysis. Select the data table with the coordinate values. |
X-values
column |
Select
the column in the data table that holds the X-axis coordinate
values. |
Y-values
column |
Select
the column in the data table that holds the Y-axis coordinate
values. |
Sorted
by column |
If desired, select a column to sort the values by. If none is selected, the line is drawn in the order of appearance of all values. |
Empty
values |
|
Ignore
(skip) empty values |
Click this radio button to ignore any missing values and continue the line using the next coordinate pair. |
Split
curve at empty values |
Click this radio button to split the curve once an empty value is encountered. |
Curve
name |
|
Automatic |
Sets an automatic name for the line. |
Custom |
Allows you to set a custom name for the line by typing a name in the text field. |
See also: