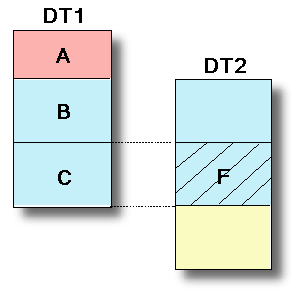
When you have multiple data tables that are related to each other in your analysis, and the data tables do not include exactly the same rows, you may want to handle filtering in the related data tables in different ways, depending on whether you are interested in the filtered rows or the filtered out rows. To help show the difference between the three options available, we use an example with two related data tables, DT1 and DT2. Both DT1 and DT2 contain rows that are not available in the other data table (pink and yellow), but they also contain common rows (blue):
A = Rows in DT1 that are not available in DT2.
B = Rows in DT1 that are available in DT2, but have been filtered out.
C = Rows in DT1 that are available in DT2 and included in the currently filtered rows of DT2.
F = The filtered rows (rows remaining after filtering) in DT2.
When the filtering management for DT2 is specified (from the DT1 data table header) the different options will give the following results:
The first option will make all rows that are only present in DT1 disappear from the visualizations using DT1, since only the rows that are currently filtered in DT2 will be included. Hence, this option keeps only those rows that are present in both data tables (and have not been filtered out).
In the example above, this means that only the rows in C will remain after filtering in DT2.
The second option will remove those rows that have been filtered out from DT2 from all visualizations using DT1. Hence, this option keeps those rows that are filtered in DT2 as well as the additional rows from DT1.
In the example above, this means that A and C will remain after filtering in DT2.
The third option is to ignore any filtering done in the related data table completely. This way, all rows that are available in the current data table will remain available.
In the example above, this means that A, B and C will all remain after filtering in DT2.
Note that you need to specify how each table should respond to filtering in all other related tables separately, to be certain of what will be shown in the visualizations after filtering.
To change the way filtering in a related data table affects a data table:
Go to the Filters panel and locate the data table header for the data table of interest.
Click
on the Filtering in related data tables icon, ![]() .
.
Response:
A drop-down menu is shown, where all related data tables are available.
Note: If a relation has become invalid, the icon will turn red.
Select the data table for which you want to change how filtering should affect the current data table, and select one of the options Include Filtered Rows Only, Exclude Filtered Out Rows or Ignore Filtering.
See also: