Option |
Description |
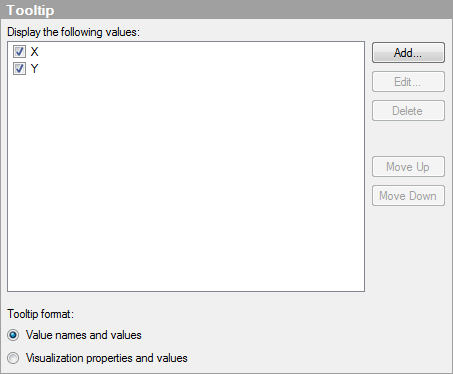
Display
the following values |
Specifies what will be shown in the tooltip. |
Add... |
Opens the Add Tooltip Value dialog, where you can add the content from another column, hierarchy, or any custom expression to be shown in the tooltip. |
Edit... |
Opens the Edit Tooltip Value dialog, where you can change the expression or the name to be shown in the tooltip. |
Delete |
Deletes the selected value from the list. |
Move
Up |
Moves the selected value up in the list as well as up in the tooltip. |
Move
Down |
Moves the selected value down in the list as well as down in the tooltip. |
Tooltip
format |
|
Value
names and values |
Shows the tooltip content in a format where the selected column name, hierarchy or custom expression is displayed. For example, Year: 2003, Type: Cucumber, etc. |
Visualization
properties and values |
Shows the tooltip content in a format where the visualization property for each value is displayed. For example, X: 2003, Color: Cucumber, etc. |
See also: