K-means clustering is an algorithm for partitioning a data table into subsets (clusters), in such a way that the members of each cluster are relatively similar.
The K-means clustering in TIBCO Spotfire is based on a line chart visualization which has been set up either so that each line corresponds to one row in the root view of the data table, or, if the line chart is aggregated, so that there is a one to many mapping between lines and rows in the root view. The clustering is initialized using data centroid based search, using unit weights, and correlation or Euclidean distance as the distance measure. The clustering is always performed on filtered rows. If you wish all rows to be included in the clustering you need to reset all filters prior to clustering. The columns the clustering operation should be based on are specified in the line chart that is used as starting point.
If "break on empty" is not active, empty values will be replaced using row (line) interpolation, similar to what is shown in the visualization. If "break on empty" is active, any rows (lines) containing empty values shall be excluded from the clustering operation.
Note: If the input line chart is trellised, the column or expression used to trellis by will be moved to the Line By setting upon running a K-means clustering. This is done in order to keep the original lines in the line chart after presenting the K-means result in trellis panels.
To reach the K-means Clustering dialog:
Make sure you have set up a line chart according to the steps in How to Perform a Line Similarity Comparison.
Select Tools > K-means Clustering....
Option |
Description |
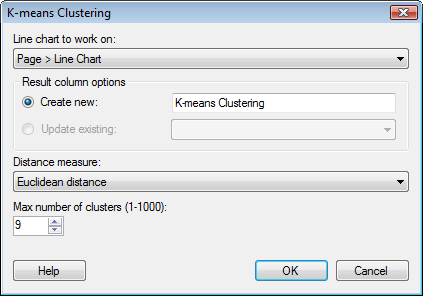
Line
chart to work on |
Select the line chart on which you want to base the calculation from the drop-down list. |
Result
column options |
|
Create
new |
Use this option to create a new K-means clustering result column. |
Update
existing |
Use this option to update a previously added result column. Only available when at least one clustering result column has been added earlier. |
Distance
measure |
Select the distance measure to base the similarity calculation on. See Distance measures for more information. |
Max
number of clusters |
The maximum number of clusters that you want to calculate (some may turn out empty and will in that case not be displayed). |
References:
Mirkin, B. (1996) Mathematical Classification and Clustering, Nonconvex Optimization and Its Applications Volume 11, Pardalos, P. and Horst, R., editors, Kluwer Academic Publishers, The Netherlands.
MacQueen, J. (1967). Some methods for classification and analysis of multivariate observations. In Le Cam, L. M. and Neyman, J., editors, Proceedings of the Fifth Berkeley Symposium on Mathematical Statistics and Probability. Volume I: Statistics, pages 281-297. University of California Press, Berkeley and Los Angeles, CA.
Hair, J.F.Jr., Anderson, R.E., Tatham, R.L., Black, W.C. (1995) Multivariate Data Analysis, Fourth Edition, Prentice Hall, Englewood Cliffs, New Jersey.
See also:
How to Perform a K-means Clustering