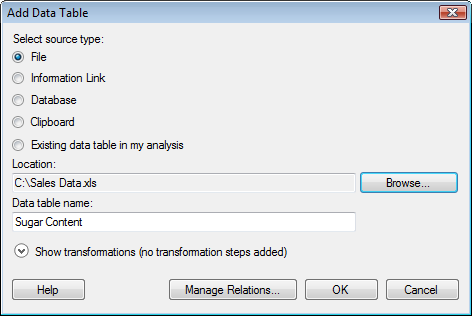
This dialog is used to add map data to a map chart visualization.
To reach the Add Data Table dialog:
Create a map chart.
Right-click in the visualization to display the pop-up menu and select Properties.
Response: The Properties dialog is displayed.
Go to the Data page.
Select Map with interactive shapes from the Map type drop-down list.
Click Add....
Comment: If you are not using a shape file, some manual configuration of the data will be needed before you can use it as a map. To learn how to do this, see Configuration of Geographical Data for Map Charts.
Option |
Description |
Select
source type |
|
File |
Allows you to add a data table from a file. |
Information
Link |
Allows you to add a data table from an information link. |
Database |
Allows you to add a data table from any supported database. |
Clipboard |
Allows you to add a data table from the clipboard. |
Existing
data table in my analysis |
Allows you to add a data table from the current analysis. |
Location |
Shows the path and file name of the selected file. |
Browse... |
Opens a dialog where you can select which file, information link, database, etc., to open. |
Data
table name |
Allows you to type a suitable name for the new data table. |
Show
transformations |
Expands the dialog and allows you to apply transformations on the data table you want to add. For more information, see the Show transformations topic. |
Manage
Relations... |
Opens the Manage Relations dialog where you can specify how the new data table is related to any previously loaded data tables in your analysis. |
See also: