Option |
Description |
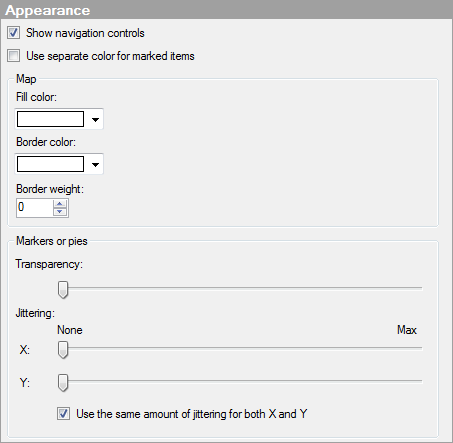
Show
navigation controls |
Specifies whether or not the navigation controls should be visible in the visualization. |
Use
separate color for marked items |
Select this check box to use the specified marking color to distinguish marked items in this visualization. If the check box is cleared, then unmarked items will be faded out instead, and the original color will be kept for the marked items. See Marking in Visualizations for more information. |
Map |
Settings to apply to the map. Note: These settings are disabled for map charts using a background image with markers or pies. |
Fill
color |
Defines which color to fill the different areas of the map with. This is only available for maps with markers or pies with polygon shapes. |
Border
color |
Defines the color to use for the border surrounding the areas in the map. This is available for maps with interactive shapes, and maps with markers or pies. Note: In a map with markers or pies where the map consists of lines or points rather than areas, the color to apply to them is decided by the border color as well. |
Border
weight |
Defines the thickness of the borders of the areas in the map. If the map consists of lines rather than areas, the border weight decides the line thickness. If the map consists of points, the border weight decides their sizes. Border weight is available for maps with interactive shapes, and maps with markers or pies. |
Markers
or pies |
Settings to apply to markers or pies in the visualization. Note: These settings are disabled for maps with interactive shapes, since no markers or pies are available in those maps. |
Transparency |
Drag the slider to change the transparency of the markers or pies. This setting can be useful for instance when you want to see where markers are placed on top of each other, or to be able to see the background image through the markers or pies. |
Jittering |
Jittering is an option that displaces the visualization items randomly in the display window, thereby making overlapping records visible. |
X |
Specifies the amount of jittering to use in the horizontal direction. |
Y |
Specifies the amount of jittering to use in the vertical direction. |
Use
the same amount of jittering for both X and Y |
Select this check box to connect the jittering sliders in both directions to each other. |
See also: