Option |
Description |
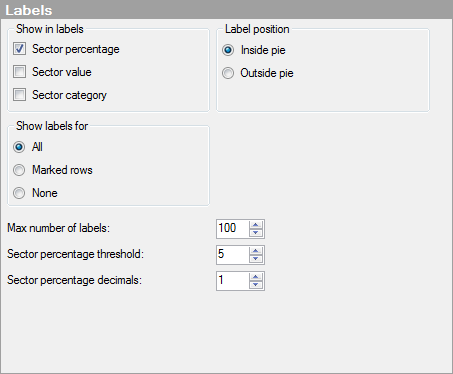
Show in labels |
Specifies what information to show in the labels for the pie sectors. |
Sector
percentage |
Displays labels showing the percentage of the total that each sector represents. |
Sector
value |
Displays the value of the sector. For example, sum of sales for apples, if the sector size is defined by sum of sales and the color is defined by fruit or vegetable type. |
Sector
category |
Displays the category defining the sector. For example, "apples", if the sector color is defined by fruit or vegetable type. |
Label position |
Specifies whether the labels should be placed Inside pie or Outside pie. |
Show
labels for |
Determines whether to show labels for all pie sectors (All), pie sectors containing marked rows only (Marked rows), or not to show any labels at all (None). |
Max
number of labels |
Specifies the maximum number of labels to be shown. |
Sector percentage
threshold |
Excludes the labels for the sectors whose percentage falls below the specified threshold value. |
Sector percentage
decimals |
Specifies the number of decimals to display for the percentage value. The number specified here will also affect the number of decimals shown for pie sectors in the tooltip. |
See also: