Option |
Description |
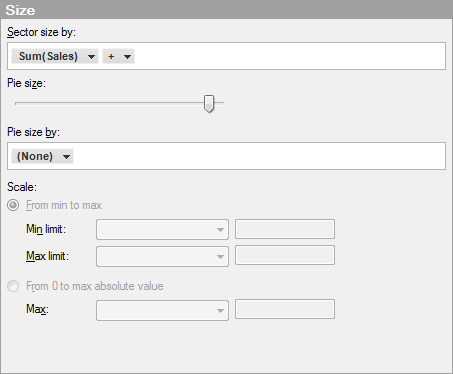
Sector
size by |
Specifies a column or hierarchy whose categories will determine the size of the pie sectors. This is always an aggregated measure. |
Pie
size |
Specifies the absolute pie size within the visualization area. |
Pie
size by |
Sizes the pies according to the values in the specified column. Only relevant when there are more than one pie available (via trellising). |
Scale |
Determines what scale to use for the size of the pie. Only relevant when there are more than one pie available (via trellising). |
From
min to max |
Assigns the maximum pie size to the highest value, and the minimum pie size to the lowest value. For instance, if the minimum and maximum data values are -9 and 11 the pie sizes could be like the following:
This mode is useful when you want to visualize differences. |
Min
limit |
The minimum and maximum limits that should be mapped to the pie size. By default, they are set to "Automatic". This means that the pie size will adapt during filtering. If the scale is set to "From min to max", the current minimum value will have the minimum pie size, and the current maximum value will have the maximum pie size. It is comparable to automatic zooming on the X- or Y-axis. It is possible to lock max limit and/or min limit to a specific value by selecting "Value" in the drop-down list and entering a value. Data values that are lower than the minimum value or higher than the maximum value will not get a size and are not drawn. By setting the lower value to 0, negative values can be removed. By specifying both a high and low value, the auto-scaling behavior is turned off. |
From
0 to max |
This mode is useful when you want to compare the magnitude of measures. By letting the value 0 map to pie size 0, and the maximum value to the maximum pie size, it is possible to compare the diameter of pie and say "a" is twice as big as "b". So with this scale the values 50 and 100 would be rendered like this:
Note: The size is scaled symmetrically around 0 with absolute numbers. That is, if your highest value is 10 and your lowest is -20, the size of the pie at 10 will be 50 percent of the maximum pie size. |
Max |
The absolute limit that should be mapped to the pie size. By default, it is set to "Automatic". This means that the marker size will adapt during filtering. The value 0 will have the minimum pie size and the highest absolute value in the visualization will have the maximum pie size. It is possible to lock this to a specific value by selecting "Value" in the drop-down list and entering a value. Data values that have a larger absolute value than the set value will get the same size as the maximum value. |
See also:

