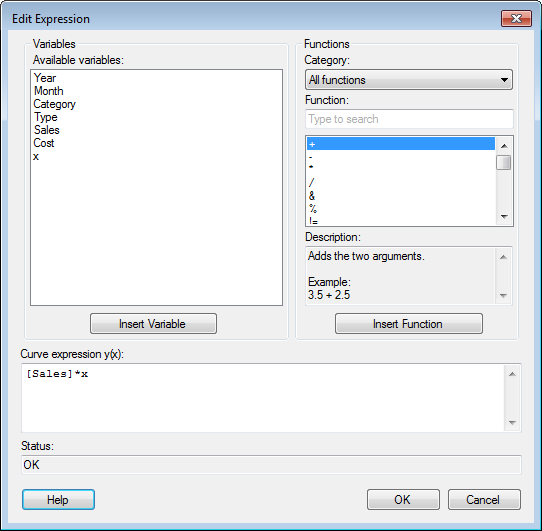
This dialog is shown when you add or edit a curve from data table from the Lines & Curves page of the Visualization Properties dialog (only available for some visualization types) and you click Edit... in the Curve from Data Table dialog.

Option |
Description |
Available
variables |
Shows all variables found in the data table that you can use in the calculation of the curve. Select a column by clicking on it in the list and then click on the Insert Columns button, or double-click on the column to send it to the Expression field. Press Ctrl or Shift to select multiple columns. |
Insert
Variable |
Inserts the variables selected in the Available variables list at the current cursor position in the Expression field. |
Category |
Select a category of functions to limit the choices in the Function list: |
Function |
Select a function by clicking on it in the list and then click on the Insert Function button to send it to the Curve expression field. Type a search string in the text field to limit the number of items in the Functions list. You can also click on any function and type the first letter of the desired function name to jump to a specific location in the list. |
Description |
Shows a brief description of the selected function. For more detailed descriptions, see the Functions chapter. |
Insert
Function |
Inserts the selected function at the current cursor position in the Curve expression field. |
Curve
expression y(x): |
This is the text field in which you build your expression. You can insert functions from the lists, or enter text as in any standard text editor. Cut/Copy/Paste works in the field using standard Ctrl+X/Ctrl+C/Ctrl+V. Also, it is possible to undo/redo the last action by pressing Ctrl+Z. |
Status |
Displays the status of the current expression. If this field shows an error, there is a problem with the expression. |
See also: