To reach the Data Table Properties dialog:
Select Edit > Data Table Properties.
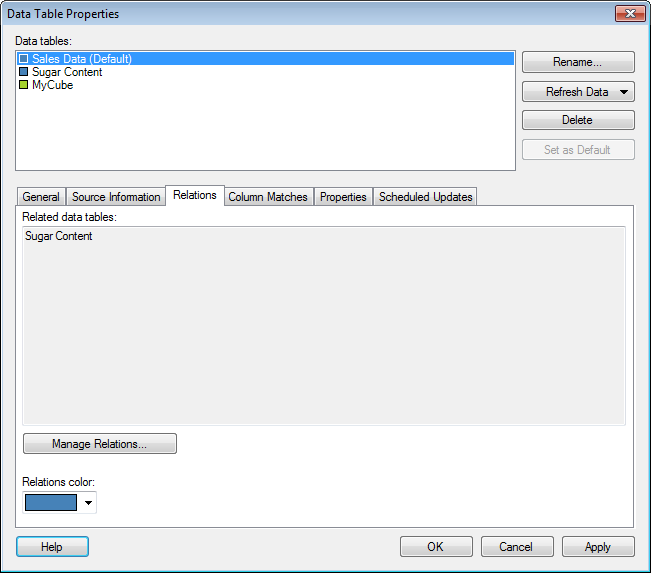
Click on the Relations tab.
Option |
Description |
Data
tables |
Lists the data tables available within the document. The names of the data tables in this list are the names that will be shown in the data table selectors, in the legends of visualizations, etc. You cannot have two data tables with identical names in the same analysis. |
Rename... |
Allows you to change the display name of the selected data table. |
Refresh
Data |
Reloads the data from the source. This is a way to refresh the data while analyzing, without having to reload the entire file. See Embedded or Linked Data? for information about what a refresh does with embedded data. You can select to refresh data With Prompt which allows you to edit transformations or import settings before the refresh or Without Prompt which uses the latest settings. Tip: If you want to reload multiple data tables simultaneously, you can instead select File > Reload Data on the main menu. Note: If a data table is loaded on demand or calculated using a data function you need to click OK in the Data Table Properties dialog to actually start the data refresh. |
Delete |
Removes the selected data table from the analysis. Any visualizations that use the deleted data table will become invalid. |
Set
as Default |
Sets the selected data table to be the default data table. This means that the selected data table will be used when new visualizations are created. You can always change the data table to use in a specific visualization from the Data page in Visualization Properties or from the Data table selector in the legend. |
Related
data tables |
Lists all other data tables which have been specified to have a relation to the selected data table. When data tables have been related, they can be set up to propagate marking and filtering (see Filtering in Related Data Tables) from one data table to another. A relation between data tables is necessary if you want to set up a details visualization where the marking in one visualization allows you to drill down to details about the selected data in another visualization. |
Manage
Relations... |
Opens the Manage Relations dialog where you can add, edit or remove relations between data tables. |
Relations
color |
Displays the color used to distinguish the data tables related to this data table from other, unrelated data tables. |
See also:
How to Edit Data Table Properties
Details on Data Table Properties - General
Details on Data Table Properties - Source Information
Data Table Properties – Column Matches
Details on Data Table Properties - Properties