An unpivot transformation is one way to transform data from a short/wide to a tall/skinny format. When the data types of source columns differ, the varying data is converted to a common data type so the source data can be part of one single column in the new data set.
Example:
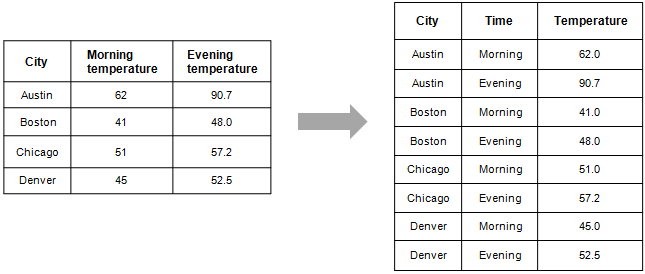
The example below shows an unpivot transformation on a very simple data set. In the original data table, there are three columns and four rows. Each row contains a city, a morning temperature and an evening temperature for each city.
While this is certainly useful, we want to determine the average temperature of all the cities for all times of day.
After unpivoting the data, we have one row for each measurement and can easily get an average value for the Temperature column in the analysis after the data has been imported.
Note: Observe that the morning temperatures were given as integers and the evening temperatures as real numbers. In the unpivoted data table, these values must have the same data type to be used in the same column. Integers are therefore changed to real numbers (changing the real number temperatures to integers, while still somewhat compatible in this case, would have resulted in a loss of information).
Example:
In this example, we have a larger data set containing data on the sales of entrance tickets for a museum. The original data table shows data for each of the five ticket counters (desks) and the number of tickets they have sold to adults, children and senior citizens each day.
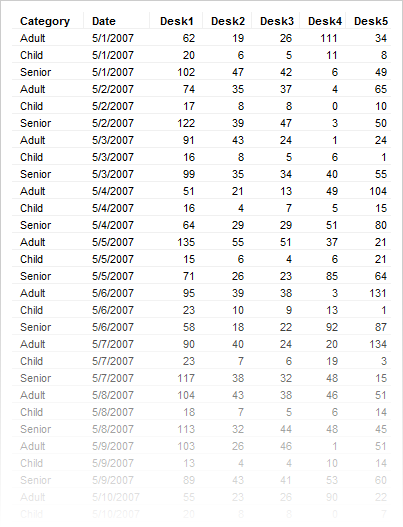
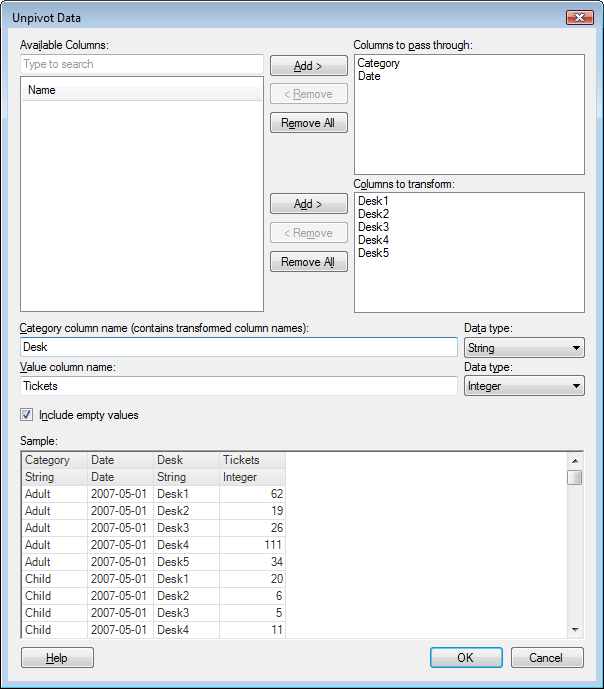
However, at this point, rather than needing to know which counter sold how many tickets to whom, we are more interested in analyzing our ticket sales in general. Therefore, we unpivot the data, combining the Desk columns into one, which we name "Desk" and merging all ticket sales to another column, which we name "Tickets".
After importing the data into Spotfire, we can start analyzing it.
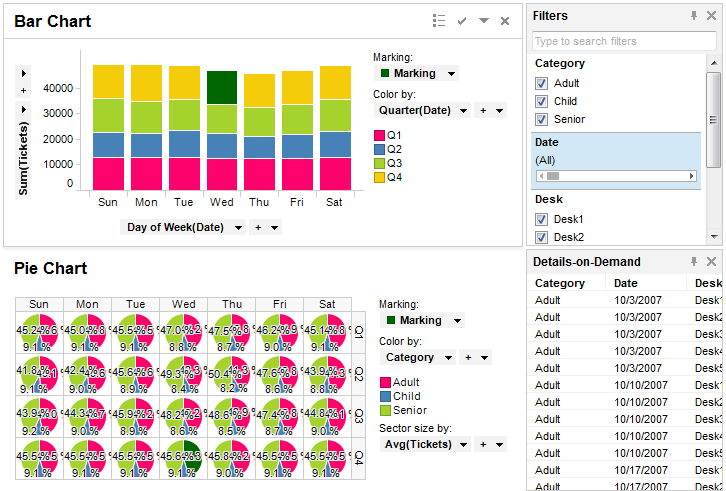
Looking at the analysis, we can now see that Thursdays are the days when we sell the least amount of tickets, and that the second and third quarters is the time of year when the museum sells the least amount of tickets.
See also: