The Application Profiler is used to gather information about analysis files. Given a set of files, local or from the library, the tool loads each file and outputs a number of data tables in STDF files (e.g., one with one row per analysis file, one with one row per data table, and one with one row per visualization). The Application Profiler is a useful tool before or after a hotfix, patch or a major release of Spotfire. As the output from the tool can be examined, it allows you to monitor if any visualizations or other parts of the analysis appear or behave differently over time (e.g., how many visualizations does the analyses have, has the total rendering time changed over the last three months, has there been any changes in the time it takes to load data in a specific analysis).
Note: To get access to the Application Profiler, TIBCO Spotfire Diagnostics, as well as the license feature called Application Profiler below it, must be enabled in Administration Manager.
To reach the Application Profiler dialog:
Select Tools > Diagnostics > Application Profiler
f
General information
The Application Profiler dialog allows you to customize paths, options, and scripts, and save them locally to your computer as a configuration, ready to be loaded into the tool again.

Option |
Description |
Load Configuration |
Allows you to open a previously saved configuration.
|
Save Configuration |
Saves a configuration locally on your computer. |
Reset Configuration |
Clears all paths, options, and scripts in the dialog. |
Included paths |
Lists added files or folders from either your local computer or from the library. |
Add
|
Opens a dialog allowing you to select a folder or a file, local or from the library. |
Remove |
Removes the selected folders or files from the list. |
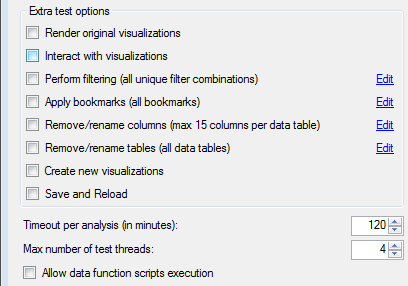
Extra test options
The tool can optionally perform a set of predefined tests. If no options are selected, the tool only gathers basic information.

Option |
Description |
Extra test options |
List of available options for testing and rendering. Most of these options perform an implicit undo after each operation. |
Render original visualizations |
'Original' refers to the visualization as it looks when opening the analysis for the first time (e.g., without applied bookmarks or filtering). In addition to writing out basic information about the visualization, this option adds columns for visualization error, rendering issues, rendering time, whether the visualization configuration is valid, and the rendered image. |
Interact with visualizations |
Interacts with visualizations using e.g., marking, highlighting. |
Perform filtering
|
Performs filtering and renders all visualizations for all combinations of filter type and data type. |
Apply bookmarks
|
Applies all bookmarks found in the analysis, and for each bookmark, renders all visualizations. |
Remove/rename columns |
For each column in each data table, the column is removed and all visualizations are rendered. After that, each column in each data table is renamed and all visualizations are rendered again. |
Remove/rename data tables |
For each data table, the table is removed, and all visualizations are rendered. After that, each data table is renamed and all visualizations are rendered again. |
Create new visualizations |
Creates one new visualization of each type. |
Save and Reload |
After performing all available test options on an analysis, the file is reloaded, saved in the current file format, and tested again. |
Time-out per analysis (in minutes) |
A time-out is applied once for the original version of the analysis, and is initiated a second time for the new version when using Save and Reload |
Max number of test threads |
The maximum number of concurrent threads, one analysis per thread.
|
Allow data function scripts execution |
Selecting this check box means that you want to run data functions which are built into the analysis. Leaving the check box without a check mark may result in for example a data function error, a version related error or an empty visualization, but might prevent unwanted scripts to affect the system. |
Edit |
Allows you to set the test option to run all or a limited number (e.g., filters, bookmarks, columns and data tables). |
Scripts
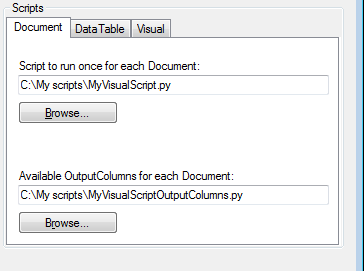
The tool allows you to load customized scripts in order to highlight and present specific data in a document, data table or a visual.

Option |
Description |
Scripts |
Supports custom scripts that can be executed once for each document, data table and visual. |
Document |
Runs a script for each document. A variable called Document will be available. |
DataTable |
Runs a script for each data table. A variable called DataTable will be available.
|
Visual |
Runs a script for each visual. A variable called Visual will be available. |
Script to run once for each ... |
Shows the current script to run. |
Available OutputColumns for each ... |
Shows the current script used to configure additional output columns for the document, data table, or visualization output data tables. |
Example
The following IronPython scripts can be used to gather information about bar orientation in all the bar charts in a set of DXP files. The output column script defines a column called BarChartOientation with data type string, and the main script gathers information by outputting values to that column.
To create the script in IronPython for defining available output columns:
Open a new document in a text editor of your choice.
Type the following script:
Note: For
defining available output columns, you always have to add to OutputColumnDataTypes
from System import Tuple, String
from Spotfire.Dxp.Data import DataType
OutputColumnDataTypes.Add(Tuple.Create[String,DataType]("BarChartOrientation",
DataType.String))
Save the document locally to your computer with the file extension suffix .py.
Load in Available OutputColumns for each Visual.
To create the main script in IronPython to run once for each visual:
Open a new document in a text editor of your choice.
Type the following script:
import Spotfire.Dxp.Application.Visuals.BarChartOrientation as barChartOrientation
from Spotfire.Dxp.Application.Visuals import BarChart
from Spotfire.Dxp.Application.Visuals import VisualTypeIdentifiers
if (Visual.TypeId == VisualTypeIdentifiers.BarChart)
if
(Visual.As[BarChart]().Orientation == barChartOrientation.Horizontal):
OutputColumns["BarChartOrientation"]
= "HORIZONTAL"
else:
if
(Visual.As[BarChart]().Orientation == barChartOrientation.Vertical):
OutputColumns["BarChartOrientation"]
= "VERTICAL"
Save the document locally to your computer with the file extension suffix .py.
Load in Script to run once for each Visual.
Executing the Application Profiler
Before executing the Application Profiler, you need to specify where to save the output data tables and give a title prefix to the output data tables.

Save
output tables to: |
Specifies where to save the output data tables. |
Prefix |
A title prefix for the output data tables which are saved locally to your computer. |
Start |
Starts the test by downloading and running tests on added files or folders. |
Show Analysis |
Provides a quick shortcut to create an analysis from where the output tables are saved. |