Option |
Description |
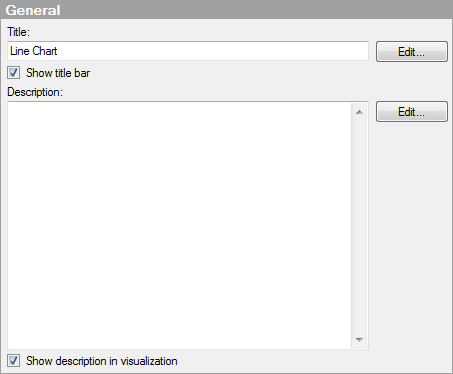
Title |
The title of the visualization. Tip: Double-click on the title bar of the visualization for a shortcut to this field. |
Edit... |
Opens the Edit Title dialog where you can add properties to the title so that it changes with a selection. For example, you may want the visualization title to change depending on the columns or expressions you specify on the axes. See Titles and Descriptions Overview for some examples. |
Show
title bar |
Specifies whether or not to show the visualization title. |
Description |
A description of the visualization. This description can optionally be shown in the legend and/or in the visualization. |
Edit... |
Opens the Edit Description dialog where you can add properties to the description so that it changes with a selection. For example, you may want the description to change depending on the columns or expressions you select on the axes. See Titles and Descriptions Overview for some examples. Example: If you specify the example above as the description and then select Avg(Sales) on the value axis, and Year on the category axis, the visualization description will be displayed as "This visualization shows Avg(Sales) over Year.". |
Show
description in visualization |
Specifies whether or not to show the description in the visualization. |
See also: