Option |
Description |
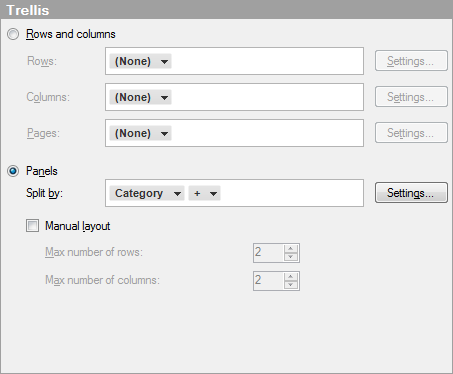
Rows
and columns |
Splits the visualization into different panels for all categories in the selected column or hierarchy. The number of values in the specified column or hierarchy controls the number of panels to be displayed in each row, column, or page, respectively. |
Rows |
A row with trellis panels will be created for each value in the selected column or hierarchy. |
Columns |
A column with trellis panels will be created for each value in the selected column or hierarchy. |
Pages |
A new page with trellis panels will be created for each value in the selected column or hierarchy. Scroll down in the visualization to see the next page. |
Panels |
Splits the visualization into different panels for all categories in the selected column or hierarchy, without binding any dimensions to either rows or columns. This means that the number of actual values in the column to split by does not control the number of shown rows or columns in any way. The number of panels that should be visible on each page is instead specified using the Max number of rows and Max number of columns controls below. |
Split
by |
Specifies the column or hierarchy to define the categories by which the visualization should be split. |
Manual
layout |
Select the check box to manually specify the number of rows and columns that should be visible without scrolling. If the check box is cleared, the application will automatically specify the number of rows and columns. |
Max
number of rows |
Specifies the maximum number of panels that should be visible on each page. |
Max
number of columns |
Specifies the maximum number of panels that should be visible on each page. |
Settings... |
Opens the Advanced Settings dialog where you can change the category mode to determine which combinations to show. |
See also: