To reach the Geometry Renderer Settings dialog:
In the Table Properties Columns page, click to select a column that uses the Geometry Renderer, then click Settings... .
OR
Click Settings... in the Scatter Plot Properties or Map Chart Properties Labels page, or in the Add Tooltip dialog, when Show as: Geometry has been chosen.
OR
Click Settings... in the Add/Edit Default Renderer dialog when the Geometry Renderer has been chosen.
Note: If you apply renderer settings from the visualization properties, the settings are applied to that visualization only. If you apply renderer settings from the Add/Edit Default Renderer dialog, the settings are applied to all new visualizations.
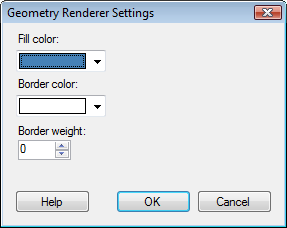
Option |
Description |
Fill
color |
Defines which color to fill the different geometries with. |
Border
color |
Defines the color to use for the border surrounding the geometries. |
Border
weight |
Defines the thickness of the borders of the geometries. |
See also: