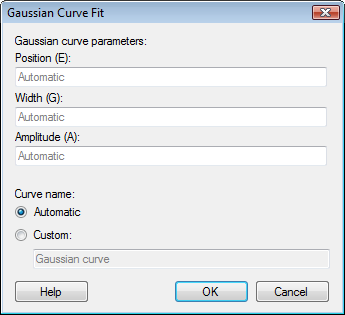
This dialog is shown when you add or edit a Gaussian curve fit from the Lines & Curves page of the Visualization Properties dialog (only available for some visualization types).

Option |
Description |
Gaussian
curve parameters |
|
Position
(E) |
Allows you to specify the position of the center point for the Gaussian distribution curve. |
Width
(G) |
Allows you to specify the width of the Gaussian distribution curve. |
Amplitude
(A) |
Allows you to specify the altitude (height) of the Gaussian distribution curve. |
Curve
name |
Specifies whether an Automatic curve name should be created, or whether you instead wish to type a Custom curve name. |
Leaving the curve parameter fields blank will let the application automatically create curve parameter values based on the currently used data.
Note that if you specify curve parameters that are very far away from the data values, no curve will be drawn.
See also: