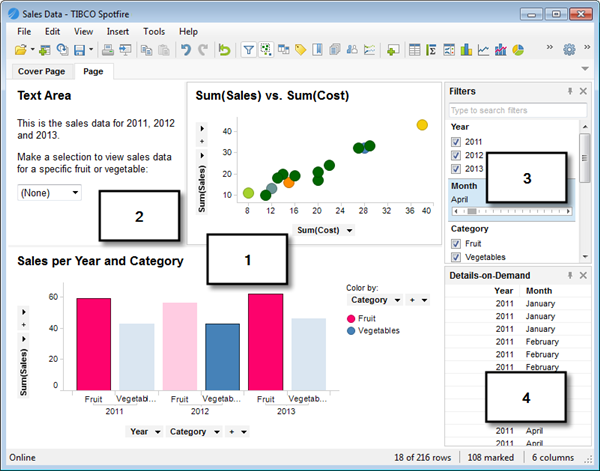
The image below shows some of the main parts of the TIBCO Spotfire® user interface.
1. Visualizations
Visualizations are the key to analyzing data in Spotfire. A variety of visualization types can be used to provide the best view of the data:
Different types of visualizations can be shown simultaneously. They can be linked to each other, and may or may not be updated dynamically when the corresponding filters on the page are manipulated (see below).
Visualizations can be made to reflect many dimensions of data by letting values control visual attributes such as size, color, shape, etc.
2. Text areas
You can type text in text areas, explaining what is seen in the different visualizations. This can be particularly useful if you are creating analytic applications for other users. Text areas can also include several different types of controls, allowing you to filter, perform actions or make selections to view particular types of data, etc.
3. Filters
By adjusting filters, you can reduce the data seen in the visualizations to "drill down" to the things that interest you. Filters are powerful tools that quickly let you see various aspects of your data and make discoveries.
Filters appear in several forms, and you can select the type of filter device that best suits your needs (for example, check boxes, sliders, etc). When you manipulate a filter by moving a slider or by selecting a check box, all linked visualizations are immediately updated to reflect the new selection of data. By default, all new visualizations on a page will be limited by the filtering scheme used on the page. However, the filtering scheme can be changed for each visualization separately.
4. Details-on-Demand
The Details-on-Demand window can be used to show the exact values of a row or a group of rows. By clicking an item in a visualization, or marking several items by clicking and dragging with the mouse around them, you can see the numerical values and textual data they represent directly in the Details-on-Demand window.
See also: