This dialog contains information that may be useful in contact with TIBCO Spotfire customer support, as well as possibilities for specifying client side logging and error reporting.
To reach the Support Diagnostics and Logging dialog:
Select Help > Support Diagnostics and Logging.
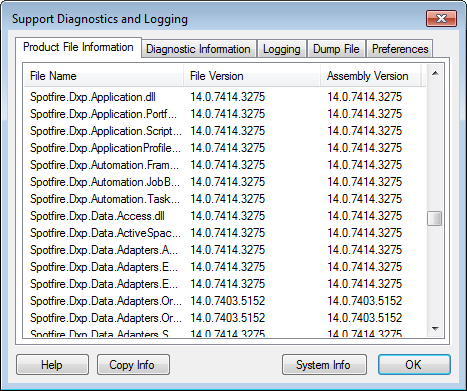
Product File Information Tab
Option |
Description |
Product
File Information |
Displays detailed information about the versions of various files and assemblies. |
Copy Info |
Copies all information available in the Support Diagnostics dialog to the clipboard. This is often requested if you are in contact with Spotfire Support. |
System
Info |
Opens the Microsoft System Information dialog, displaying additional information. |
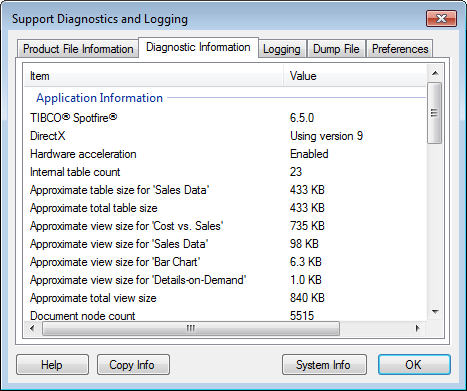
Diagnostic Information Tab
Option |
Description |
Application
Information |
Lists the version of TIBCO Spotfire and DirectX installed on your computer as well as information about whether or not hardware acceleration is enabled. |
System
Information |
Lists the name and version of your operative system, as well as the .NET version on your computer. |
Spotfire
Server Information |
Lists the name of the TIBCO Spotfire Server and the deployment area on the server you are connected to. This section also includes information about the operating system on the server and other information about the server that may be of interest to support. |
TIBCO Spotfire
Statistics Services for S-PLUS |
Lists information about TIBCO Spotfire Statistics Services and the currently used S-PLUS engine. |
TIBCO Spotfire
Statistics Services for R |
Lists information about TIBCO Spotfire Statistics Services and the currently used R engine. |
TIBCO Spotfire
Statistics Services for TIBCO Enterprise Runtime for R |
Lists information about TIBCO Spotfire Statistics Services and the currently used TIBCO Enterprise Runtime for R engine. |
TIBCO Spotfire
Statistics Services for SAS®
Software |
Lists information about TIBCO Spotfire Statistics Services and the currently used SAS engine. |
TIBCO Spotfire
Statistics Services for MATLAB® |
Lists information about TIBCO Spotfire Statistics Services and the currently used MATLAB engine. |
Copy Info |
Copies all information available in the Support Diagnostics dialog to the clipboard. This is often requested if you are in contact with Spotfire Support. |
System Info |
Opens the Microsoft System Information dialog, displaying additional information. |
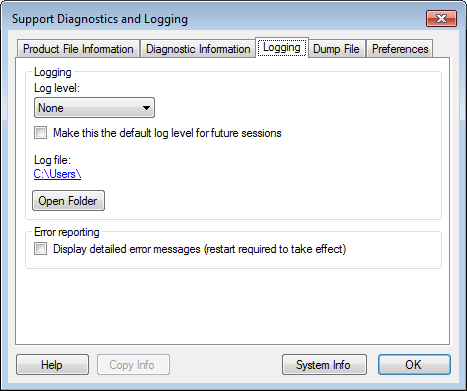
Logging
The logging tab settings are not available if you have created a custom log4net.config file, see Make this the default log level for future sessions below for more information.
Option |
Description |
Log
level |
Allows you to specify the log level. An increased log level may be useful when communicating with TIBCO Spotfire Support, while trying to troubleshoot TIBCO Spotfire. |
None |
This is the default log level if nothing else is specified. No information is logged. |
DEBUG |
Used to log detailed information and events when debugging the application. This is the log level that collects the most information. |
INFO |
Used to log information regarding the progress of the application, including all potentially harmful situations and errors. |
WARN |
Used to discover all kinds of potentially harmful situations. |
ERROR |
Used when tracking fatal and non-fatal error events. |
FATAL |
Used when tracking severe error events only. |
Select the check box to make Spotfire remember the selected log level from session to session. If the check box is selected your current log settings will be saved in a log4net.config file. If the check box is cleared, then the generated config file will be deleted. The automated logging settings will not be available if you already have a custom log4net.config file in the TIBCO Spotfire AppData directory. |
|
Log
file |
Shows the path to the log file. Click on the link to open the log file directly. |
Open
Folder |
Opens Windows Explorer to the folder containing the log file. |
Display
detailed error messages (restart required to take effect) |
Allows detailed error messages to be displayed. For the setting to take effect you need to restart Spotfire. |
System
Info |
Opens the Microsoft System Information dialog, displaying additional information. |
Dump File
The dump file tab allows you to create a dump file which can be sent to TIBCO Spotfire support and be of use when investigating problems. The chances of getting your problems fixed greatly increases if you can attach a dump file to your support issue.
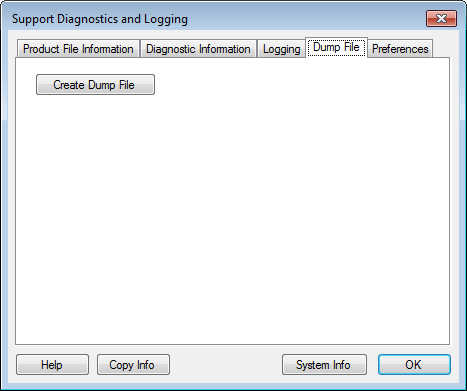
Click on the Create Dump File button to create a TIBCO Spotfire dump file. You will be prompted to specify the name and location of the file.
The dump file contains all information about your analysis, including the current data and all analysis steps performed so far.
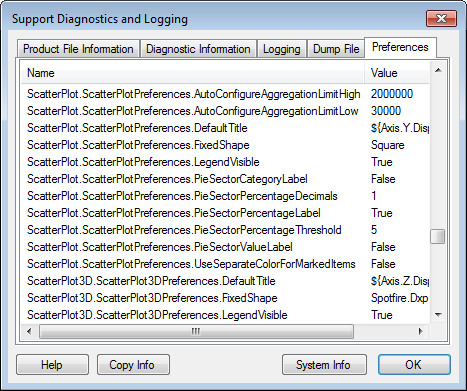
Preferences
Displays the currently used preference settings. Since your own default settings made under Tools > Options will take precedence over any settings made by the administrators, it may be important to compare the currently used preference settings when troubleshooting specific analyses.