Percentiles and Quartiles
Percentiles
A percentile is a measure at which that percentage of the
total values are the same as or below that measure. For example, 90% of
the data values lie below the 90th percentile, whereas 10% of the data
values lie below the 10th percentile.
Quartiles
Quartiles are values that divide a (part of a) data table
into four groups containing an approximately equal number of observations.
The total of 100% is split into four equal parts: 25%, 50%, 75% and 100%.
The first quartile
(or lower quartile), Q1, is defined as the value that has an f-value equal
to 0.25. This is the same thing as the twenty-fifth percentile. The third quartile (or upper quartile),
Q3, has an f-value equal to 0.75. The interquartile range, IQR, is defined
as Q3-Q1.
The f-value of each value
in the data table is computed:

where i is the index of the
value, and n the number of
values.
The first quartile is computed
by interpolating between the f-values immediately below and above
0.25, to arrive at the value corresponding to the f-value 0.25.
The third quartile is computed
by interpolating between the f-values immediately below and above
0.75, to arrive at the value corresponding to the f-value 0.75.
Any other percentile is similarly
calculated by interpolating between the appropriate values.
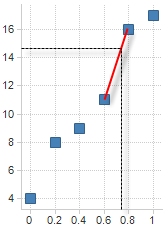
Example:
Value |
f-value |
4 |
0 |
8 |
0.2 |
9 |
0.4 |
11 |
0.6 |
16 |
0.8 |
17 |
1.0 |
Interpolation at f-value=0.75 yields Q3=14.75.
See
also:
Adjacent
Values and Outliers
Aggregations Overview