The data that is to be loaded on demand can be controlled in a number of ways. See Loading Data on Demand for more information. The example below uses a property control in a text area to select which data to display in a bar chart based on an on-demand data table.
In this example, we first assume that we have a data table containing a string column called "Type" which lists a number of different product types loaded in the analysis. We also assume that there is an information link with some additional data available, which also contains a "Type" column. See Creating an Information Link if you need information about how to set up information links.
To add an on-demand data table using input from a document property value:
Select File > Add Data Tables....
Response: The Add Data Tables dialog is displayed.
Click Add and select the data source (an information link or a data connection). In this example, we use an information link.
Response: The Select Information Link dialog is displayed.
Browse to the information link holding the desired data and select it in the list.
Click OK.
Response: The information link is added to the Data tables list in the Add Data Tables dialog.
If desired, change the Name for the new on-demand data table.
Select the Load on demand check box.
Click on Settings....
Response: The On-Demand Settings dialog is displayed.
In the Define input for parameters that should control loading list, click to select the column containing the product types.
Click Define Input....
Response: The Define Input dialog is displayed.
In the Input for the selected parameter list, select Values (fixed/properties/expression).
Click on the Property radio button.
Click Select....
Response: The Select Property dialog is displayed.
If no suitable property is available, click New... in the Document Properties tab.
Response: The New Property dialog is displayed.
Define a string property using one of the available product types as default value. For example, create a string property called "Type" with the value "Apples".
Click OK in all dialogs.
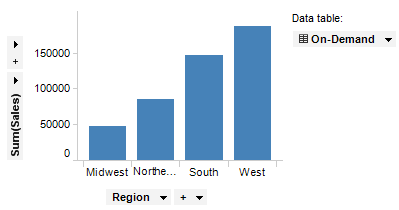
Response: The on-demand data table is loaded using the limiting default value and a visualization is displayed. In the example below, the visualization shown is a bar chart displaying the sum of sales for Apples in four different regions.
To add a property control for changing the document property to a text area:
Create or activate a text area.
Click on the Toggle Edit Mode
button, ![]() ,
in the title bar of the text area.
,
in the title bar of the text area.
Type some descriptive text to help other users understand what the control will do.
Click on the Insert Property
Control button, ![]() , and select which type of control
to add. In this example we will add a drop-down list.
, and select which type of control
to add. In this example we will add a drop-down list.
Response: The Property Control dialog is displayed.
Select the previously specified document property.
Select Set property value through: Unique values in column.
Select the Data table to be the first data table in the analysis (not the on-demand data table).
Select the "Type" Column.
If desired, limit the values to be displayed in the drop-down list using a search expression.
Comment: Only those values matching the search expression will be shown in the control. See Searching in TIBCO Spotfire for more information about valid search expressions.
Click OK.
Response: The property control is added to the text area.
Click on the Toggle Edit Mode button again to exit the edit mode.
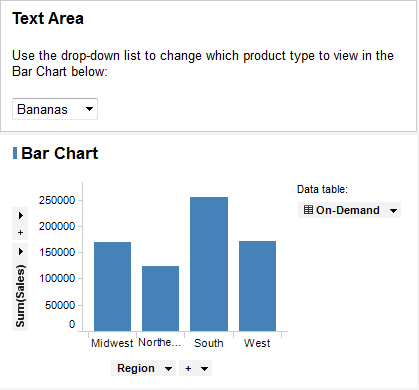
You can now use the property control to change which product type to look at in the visualization. If Load automatically has been selected in the on-demand settings, the visualization will be updated each time the property is changed via the control. If Load automatically has not been selected, a refresh button will be displayed in the title bar of the visualization each time the input is changed.
See also:
Using Properties in the Analysis