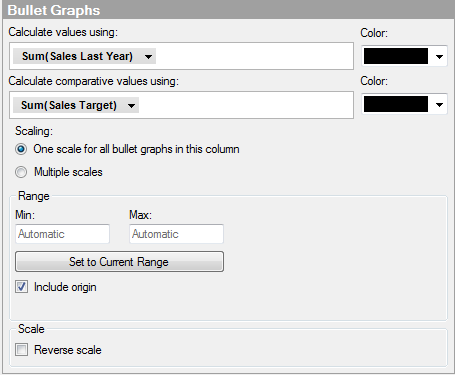
Bullet Graph in Graphical Table
Option |
Description |
Calculate
values using |
Specifies the column, hierarchy, or expression you want the horizontal bar in the bullet graph to be based on. |
Color |
Specifies the color of the horizontal bar in the bullet graph. |
Calculate
comparative values using |
Specifies the column, hierarchy, or expression you want the vertical line representing the comparative value in the bullet graph to be based on. |
Color |
Specifies the color of the vertical line representing the comparative value. |
Scaling |
|
One
scale for all bullet graphs in this column |
Use this option if you want all the bullet graphs in this column of the graphical table to use the same scale. |
Multiple scales |
Use this option if you want each bullet graph in this column to use its own individual scaling. |
Range |
|
Min |
Determines the lower value of the scale range. Leave the field blank to automatically adjust the range to the currently lowest value in the filtered data. |
Max |
Determines the upper value of the scale range. Leave the field blank to automatically adjust the range to the currently highest value in the filtered data. |
Set to Current Range |
Sets the scale range to the currently filtered values. |
Include
origin |
Always includes the value 0 in the bullet graph, regardless of filtering. |
Scale |
|
Reverse
scale |
Reverses the current sort order on the scale. |
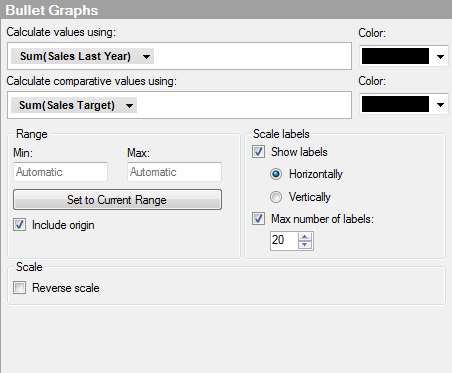
Bullet Graph in Text Area
Option |
Description |
Calculate
values using |
Specifies the column, hierarchy, or expression you want the horizontal bar in the bullet graph to be based on. |
Color |
Specifies the color of the horizontal bar in the bullet graph. |
Calculate
comparative values using |
Specifies the column, hierarchy, or expression you want the vertical line representing the comparative value in the bullet graph to be based on. |
Color |
Specifies the color of the vertical line representing the comparative value. |
Range |
|
Min |
Determines the lower value of the scale range. Leave the field blank to automatically adjust the range to the currently lowest value in the filtered data. |
Max |
Determines the upper value of the scale range. Leave the field blank to automatically adjust the range to the currently highest value in the filtered data. |
Set to Current Range |
Sets the scale range to the currently filtered values. |
Include
origin |
Always includes the value 0 in the bullet graph, regardless of filtering. |
Scale labels |
|
Show
labels |
Specifies whether or not scale labels should be visible. |
Horizontally |
Shows scale labels horizontally. |
Vertically |
Shows scale labels vertically. |
Max number
of labels |
Select the check box to specify a maximum number of scale labels to be shown. Limiting the number of labels can improve readability on scales with many values. |
Scale |
|
Reverse
scale |
Reverses the current sort order on the scale. |
See also:
How to Use the Graphical Table