A cross table is a two-way table consisting of columns and rows. It is also known as a pivot table or a multi-dimensional table. Its greatest strength is its ability to structure, summarize and display large amounts of data. Cross tables can also be used to determine whether there is a relation between the row variable and the column variable or not.
Optionally, the cross table can display grand totals for columns, rows, or for the whole measure. It can also display subtotals for columns, or show images on the horizontal or vertical axis.
Note: The aggregated value for subtotals and grand totals is not calculated on the values shown in the cross table, but on the underlying row values. This means that if you hide rows on the Sorting page or if you are using Show/Hide Items rules, then the grand totals or sub totals will be the sum of all values and not the sum of the visible values.
Examples:
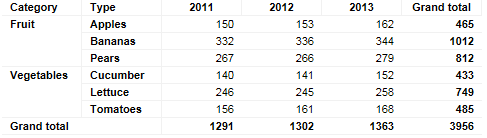
Below is a cross table showing sales figures for different types of fruits and vegetables.
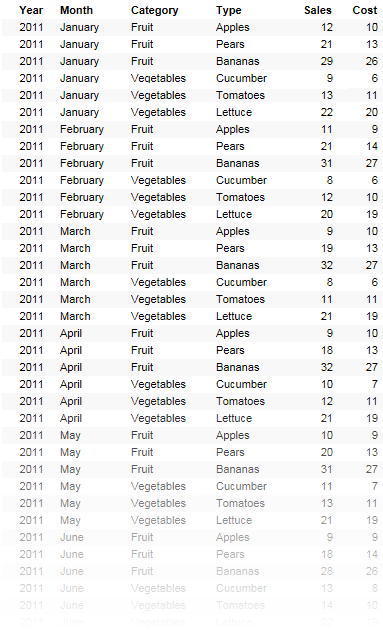
The same data displayed in a regular table takes up far more space and it is much more difficult to get an overview:
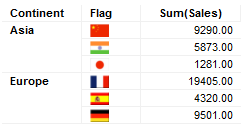
Cross tables can also be configured to show images in axis labels, provided that one of the following is fulfilled:
Images are acquired via an URL, built up by the content of the selected expression/column. The actual image may then reside in a file on the network, or on the Internet, and is rendered using the Image from URL option in the Label Rendering dialog.
Images are stored in BLOB columns in an in-memory data table and rendered directly as images.
A virtual column producer is available which can transform the value from the chosen expression/column into a desired output. For example, for users of TIBCO Spotfire for Lead Discovery a column containing the IDs of molecules can be used on the axis and the corresponding Molfiles can be fetched from a database and rendered as images in Spotfire.
All visualizations can be set up to show data limited by one or more markings in other visualizations only (details visualizations). Cross tables can also be limited by one or more filterings. Another alternative is to set up a cross table without any filtering at all. See Limiting What is Shown in Visualizations for more information.
See also: