Pivot Data can be used to transform data from a tall/skinny format to a short/wide format.
Tip: You can replace a data table with a transformed version of itself.
To add a Pivot Data transformation when adding a data table:
Select File > Add Data Tables... and add the data of interest.
Click Show transformations.
Select Pivot from the drop-down list and click Add....
Tip: The Show transformations-section is also available when replacing data tables and when adding columns or rows to a data table.
To add a Pivot Data transformation to data that is already loaded into Spotfire:
Select Insert > Transformations....
In the Data table drop-down list, select the data table you want to add a pivot transformation to.
Select Pivot from the drop-down list and click Add....
Option |
Description |
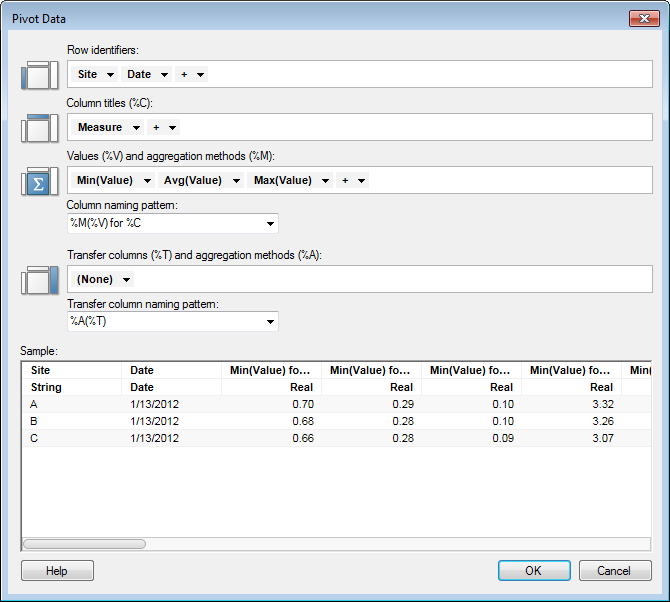
Row
identifiers |
Each unique value in the chosen identity column or hierarchy produces a row in the generated table. If you choose more than one column, the new table will have a separate row for each unique combination of values in the chosen columns. |
Column titles (%C) |
Each unique value in the chosen category column or hierarchy produces a new column for each aggregation method in the generated data table. Selecting more than one column means that the new data table will have a separate column for each unique combination of values in the chosen columns. The column titles are used in the column naming pattern, see below. |
Values
(%V) and aggregation methods (%M) |
The column from which the data values are calculated. The values in the generated data table are computed according to the method selected under Aggregation in the column selector menu (for example, Average). A list of aggregation methods can be found on the Statistical Functions page. Note: In addition to the methods found on the statistical functions page, the method Count() can be used. It includes all values, including empty values, and therefore returns the total number of rows in the column. Note: If you are certain that each combination of Identity and Category has a unique value, then you can select the Aggregation: None which will not apply any aggregation of the data. However, the pivot will fail if you select None, and each combination of Identify and Category is not unique. |
Column
naming pattern |
You can select how the pivoted columns should be named. By default the predefined option is: Method(Value) for Column You can also create a custom naming scheme for your pivoted columns. By clicking the drop down list, you can choose from the recently used names. The resulting new columns will be alphabetically ordered by the names determined by the naming expression. |
Transfer
columns (%T) and aggregation methods (%A) |
This option allows you to include an overall average, or any other aggregation method listed on the Statistical Functions page, of a particular measurement, for each row in the generated table. Note: Except for the methods found on the statistical functions page, the method Count() can be used. It includes all values, including empty values, and therefore returns the total number of rows in the column. |
Transfer
column naming pattern |
You can select how the transfer columns should be named. By default the predefined option is: Aggregation(TransferValue) By clicking the drop down list, you can choose from the recently used names. |
Sample |
Gives you a sample of what the resulting data table will look like. Note: Uses the first 100 rows from the data table, so there might be some differences between the sample and the resulting data table. |
See also: