Option |
Description |
Color
by |
Lists the alternatives by which it is possible to color the heat map. The drop-down list contains the columns that are visible on the horizontal and vertical axes of the heat map. It also contains the alternative (Cell Values) which lets you color the heat map by the column on the cell values axis. Select the alternative you wish to color by to set up a color scheme and see the available color scheme groupings for that alternative. If the cell values axis contains more than one column, you can only color by (Cell values) and Color by drop-down list will be grayed out. |
Color
scheme groupings |
Lists the currently available color scheme groupings for the selected column. In heat maps, a color scheme is always applied to a color scheme grouping. A default color scheme grouping named Numeric is always available for each of the columns in the heat map. Before any new color scheme groupings have been added, the default grouping contains all the values in the selected column. Click on a grouping in the list to select it and see its defined color scheme in the lower part of the dialog. To learn more about color scheme groupings and coloring in heat maps, see Coloring in Cross Tables and Heat Maps. |
Add |
Opens a menu which lets you add a new color scheme grouping. The menu option Color Scheme Grouping... opens the Add Color Scheme Grouping dialog, in which you can select values in the selected column to include in the new grouping. You can also give the grouping a descriptive name. The menu also lists all the values in the selected column as separate menu options. If you select one of these values from the menu, a grouping containing only that value will be added. |
Edit... |
Opens the Edit Color Scheme Grouping dialog which lets you modify an existing grouping. You cannot edit the default grouping named Numeric. |
Remove |
Removes the selected color scheme grouping from the list. You cannot remove the default grouping named Numeric. |
Color
mode |
Specifies in which color mode to set up the color scheme. You can select one of the following color modes: Gradient, Segments, Fixed, or Unique values. To learn more about the color modes, see Color Modes Overview. |
One
scale per |
Specifies whether there should be one separate scale for each axis value, or if one scale should apply to the entire color scheme grouping. You can also select to use one scale for each trellis panel for trellised heat maps, as well as one scale for each trellis panel and each axis value in the trellis panel. |
[Color Schemes menu] |
Opens a menu where you can select an already existing color scheme and apply it to the visualization, or apply the currently open color scheme to another visualization in the analysis. |
From
Visualization |
Lets you select a color scheme from another visualization in the analysis. Only color schemes applicable to the current color scheme grouping will be listed Note: When applying the color scheme from a map chart, it will be the color scheme of the interactive layer which is applied.. |
Document
Color Schemes |
Lets you select a color scheme that has previously been saved within the analysis. Only color schemes applicable to the current color scheme grouping will be listed. This menu option is only available if one or more document color schemes already exist. |
[Predefined color schemes] |
Lists a number of predefined color schemes. For a full description of the predefined color schemes, see Predefined Color Schemes. Tip: To facilitate setting up a new color scheme, you can open a predefined color scheme with a similar appearance, and then adjust it to suit your needs. |
Open
from Library... |
Opens the Open from Library dialog where you can select a color scheme that has previously been saved to the library. |
Open
from File... |
Opens a dialog where you can select a previously saved color scheme. |
Save As |
Lets you save a color scheme as a library item, a local file or a document color scheme. Library Item – Opens the Save as Library Item dialog, where you can specify a location in the library and a file name to save the currently open color scheme for later reuse. File – Opens a dialog where you can specify a location and a file name to save your currently open color scheme locally on your computer for later reuse. Document Color Scheme – Opens the Save Document Color Scheme dialog, where you can specify a name and save the currently open color scheme for later reuse within the analysis. |
Apply
to Visualizations... |
Opens the Apply to Visualizations dialog where you can select other visualizations (within the analysis) that you want to apply the current color scheme to. Only visualizations with compatible color schemes are listed. Note: If you apply a color scheme to a table, cross table, or heat map, the coloring will not take effect immediately. The color scheme will be added as an empty color scheme grouping, and you must select which columns or axis values to include in the grouping by opening the Edit Color Scheme Grouping dialog. Note: When applying a color scheme to a map chart it is always the interactive layer that will receive the new colors. |
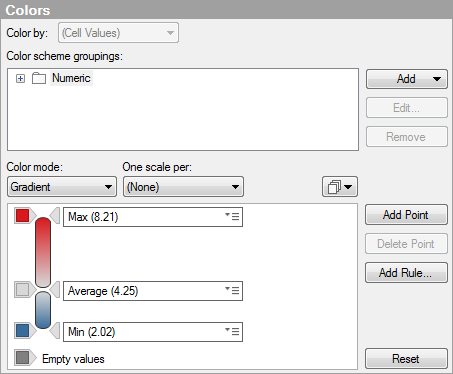
[Color scheme area] |
The area in the lower part of the dialog shows the current color scheme. That is, the colors and values currently used for the selected color scheme grouping. You can modify color schemes in numerous ways to give the visualization the appearance you prefer. The color scheme area will look different, and have different available settings, depending on the characteristics of the color scheme grouping, as well as the selected color mode. To learn more about color schemes and color modes, see Color Schemes Overview and Color Modes Overview respectively. |
Add
Point |
Adds a new anchor point to the color scheme. |
Delete
Point |
Deletes the selected anchor point. |
Add
Rule... |
Opens the Add Rule dialog where you can define a rule that functions as an exception to the rest of the defined color scheme. A rule has higher priority than the rest of the color scheme. For example, you can define a rule to give the top five items in your data a different color than the rest of the items. If you add many rules to a color scheme, the rules are prioritized from top to bottom. Which rule types are available depends on the characteristics of the color scheme grouping. See Details on Add/Edit Rule for full descriptions of the rule types. |
Reset |
Resets the color scheme to the one that was in effect when the visualization was created. Any added rules will be removed. Which color scheme should be used by default when you create a new visualization is defined in the Visualization page of the Options dialog. |
Note: The color of marked items is changed under Edit > Document Properties.
See also: