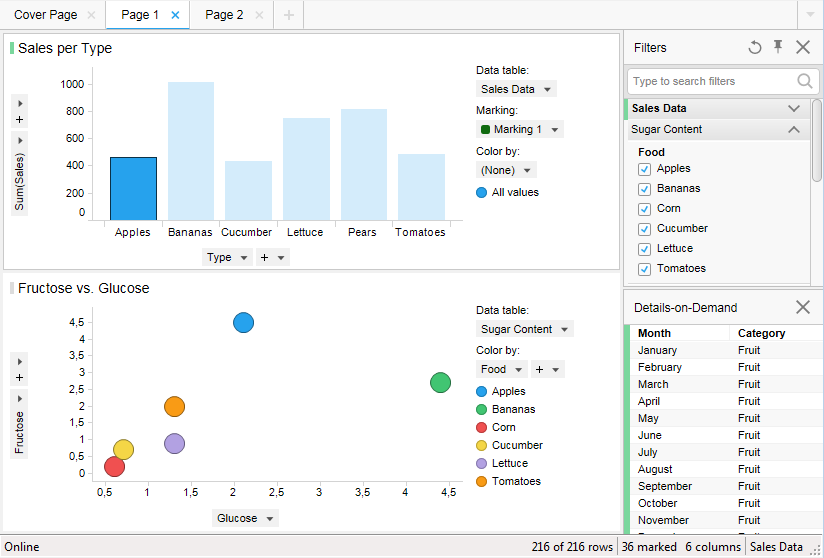
This is an example of independent data tables. These two visualizations are placed on the same page, but they are not related to each other. The visualizations correspond to separate data tables. Marking or filtering in one visualization will not affect the other when they are independent. The Details-on-Demand displays information about the marked item in the active visualization. Color stripes are used to indicate what visualization, filter and Details-on-Demand that are related.
In this example, the bar chart shows the sum of sales for different types of fruits and vegetables. The scatter plot shows the content of fructose and glucose for different types of fruits and vegetables.
See also: