A parallel coordinate plot maps each row in the data table as a line, or profile. Each attribute of a row is represented by a point on the line. This makes parallel coordinate plots similar in appearance to line charts, but the way data is translated into a plot is substantially different.
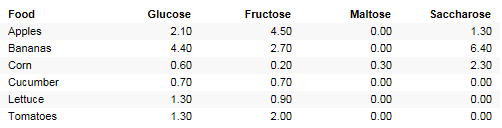
Consider, for example, a data table where a laboratory has measured the amount of various carbohydrates contained in various fruit and vegetables.
For each food type, it is now possible to plot a profile of how the carbohydrates are distributed. The technicians in the laboratory can now see which food types are similar to each other in carbohydrate distribution, by comparing the profiles to each other. This is where the parallel coordinate plot is really useful, to compare profiles in order to find similarities.
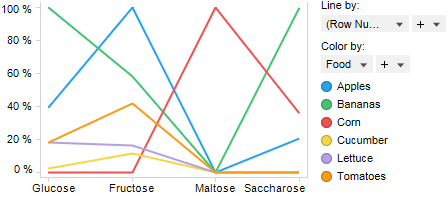
The values in a parallel coordinate plot are always normalized. This means that for each point along the X-axis, the lowest value in the corresponding column is set to 0% and the highest value in that column is set to 100% along the Y-axis. The scale of the various columns is totally separate, so do not compare the height of the curve in one column to the height of the curve in another column.
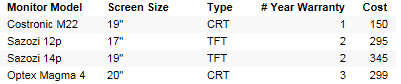
This becomes more apparent when looking at another example. This data table contains information about some models of computer monitors. As you see, the data in the various columns are of completely different types and totally incomparable to each other. They are however, perfect for a parallel coordinate plot, which normalizes the data in each column and simply plots the lowest value as 0% and the highest as 100%.
This gives us a profile for each computer monitor, which we can compare to the other profiles, and try to spot a monitor that fits our needs.
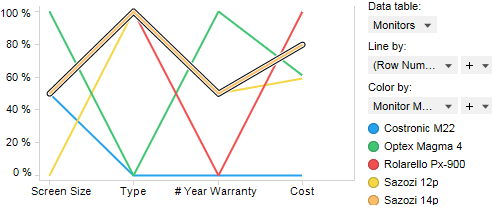
Perhaps we think that the Sazozi 14p monitor (the orange marked profile) is a good buy, since it has a medium sized screen, it is a new flat screen, it has an average warranty period, and seems to cost a bit but not in the very highest price range.
All visualizations can be set up to show data limited by one or more markings in other visualizations only (details visualizations). Parallel coordinate plots can also be limited by one or more filterings. Another alternative is to set up a parallel coordinate plot without any filtering at all. See Limiting What is Shown in Visualizations for more information.
See also:
How to Use the Parallel Coordinate Plot
Parallel Coordinate Plot Properties