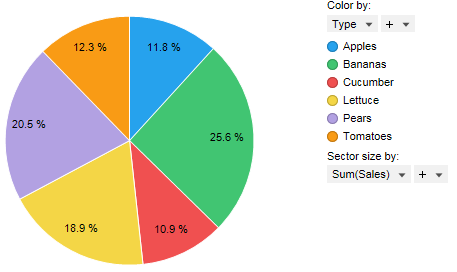
Pie charts are circle graphs divided into sectors, each pie sector displaying the size of some related piece of information. Pie charts are used to show the relative sizes of the parts of a whole.
Example:
All visualizations can be set up to show data limited by one or more markings in other visualizations only (details visualizations). Pie charts can also be limited by one or more filterings. Another alternative is to set up a pie chart without any filtering at all. See Limiting What is Shown in Visualizations for more information.
See also: