Option |
Description |
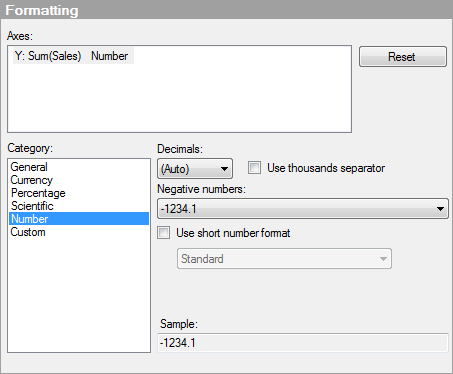
Axes |
Displays how the Y-axis start point and end point values is formatted. |
Reset |
Resets the formatting for the selected axis values according to the settings defined on column level. If no column formatting has been set, axis formatting settings defined in the Options dialog will be used. If no settings have been specified in the Options dialog, the default settings for the visualization type will be used. |
Category |
Lists the available formatting categories for the selected axis. Each category in this list has separate settings. Which categories are available depends on the data type of the selected axis. See Formatting Settings for a full description of all possible options. |
See also:
How to Use the Graphical Table