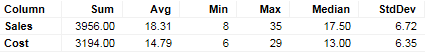
The summary table is a visualization that summarizes statistical information about data in table form. The information is based on one data table in TIBCO Spotfire. You can, at any time, choose which measures you want to see (such as mean, median, etc.), as well as the columns on which to base these measures. As you change the set of filtered rows, the Summary Table automatically updates the values displayed to reflect the current selection.
All visualizations can be set up to show data limited by one or more markings in other visualizations only (details visualizations). Summary tables can also be limited by one or more filterings. Another alternative is to set up a summary table without any filtering at all. See Limiting What is Shown in Visualizations for more information.
See also: