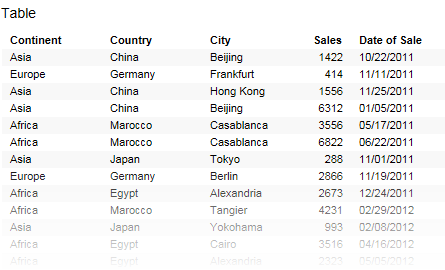
The table in TIBCO Spotfire works much like any other table you might be familiar with. It presents the data as a table of rows and columns, and is used to see details and compare values.
By clicking on a row you mark it, and by dragging the mouse pointer over several rows you can mark more than one row.
You can sort the rows in the table according to different columns by clicking on the column headers, or filter out unwanted rows by using the filters.
All visualizations can be set up to show data limited by one or more markings in other visualizations only (details visualizations). Tables can also be limited by one or more filterings. You can also set up a table without any filtering at all. See Limiting What is Shown in Visualizations for more information.
Note: When working with in-db data the table visualization cannot show more than 10 000 rows. If not all data can be shown, you will get a notification about this in the legend. A primary key must be specified in the external database table to enable highlighting and markings in the table visualization.
See also: