A details visualization is a special case of a limited visualization, slightly related to the Details-on-Demand. The information shown in a details visualization depends on what is marked in one or more other visualizations (the master visualizations). Details visualizations can be used to set up analyses where you can drill down into your data in multiple steps. The marking you perform in one visualization, determines what you will see in the next visualization, and so on.
In contrast to the Details-on-Demand, which is always a table, the details visualization can be any type of visualization and it can be placed anywhere within the page, just like any other visualization. You can create a details visualization in two different ways, as described below.
To create a new details visualization:
Load data for the master visualization and, if other data, for the details visualization.
Comment: Note that all data tables you wish to use must be loaded, and a relation must have been set up between the data tables, before you create the details visualization. See How to Insert Multiple Data Tables into the Analysis for more information about how to add more data tables and define relations between them.
Create the master visualization that you want to use to control the details visualization.
Comment: This should be the visualization in which you want to be able to mark items and retrieve details about these items in the details visualization.
Right-click in the visualization and select Create Details Visualization and the type of visualization to use as details visualization from the pop-up menu.
If there are more than one related data table available in your analysis, the Create Details Visualization dialog will appear. Select which data table to use from the Related data table for new visualization drop-down list.
Comment: If no related data tables are available, the details visualization will automatically use the same data table as the master visualization.
Click OK in the Create Details Visualization dialog.
Response: The new details visualization appears in the analysis.
Set up the new details visualization to the desired view. See below for a few tips.
To turn an existing visualization into a details visualization:
Open the Visualization Properties for the visualization that you want to use as the details visualization.
Go to the Data page.
In the Limit data using markings list, select the check box representing the marking that the master visualization is currently using.
Response: Which items are displayed in the details visualization is now controlled by which items are marked in visualizations currently using the selected marking. See below for a couple of tips on further setup of the details visualization.
It is recommended that you make sure the details visualization in itself does not use the same marking as is used to limit the data shown. Select either (None), or a different marking from the Marking drop-down list.
Example:
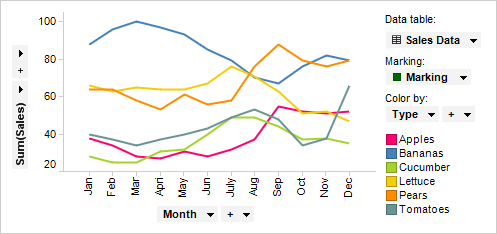
The line chart below is the visualization that will be become the master visualization in this example. It shows the sum of sales for fruits and vegetables for each month over a year, and each line represents a fruit or a vegetable:
Then, we want to investigate the carbohydrate content of the different fruits and vegetables in a details visualization where only the data for the type that we clicked on is shown.
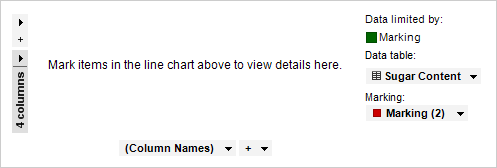
Right-click on the master visualization and select Create Details Visualization > Bar Chart.... In this example, the details data comes from a different data table than the one used in the master visualization, but it could also be the same data table.
This details visualization is set up to show the content of Glucose, Fructose, Maltose and Saccharose on the value axis and (Column Names) on the category axis. You can specify what you want the details visualization to show if no items are marked in the master visualization. In this example a descriptive message lets you know that you need to mark items in the line chart to see the details:
You can also choose to show just an empty or blank visualization, or all of the data. See below to learn more about the alternatives.
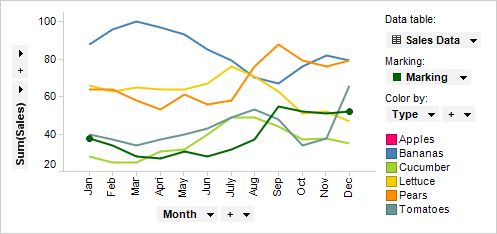
When a line is marked in the master visualization, the bar chart is updated to show data about that fruit or vegetable. In this example, the line representing Apples is marked:
The details visualization now shows the carbohydrate content of apples:
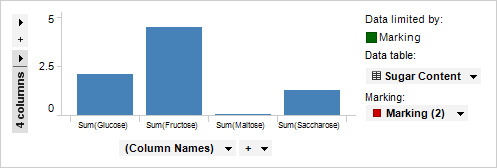
Clicking on the Bananas line will show the carbohydrate content of bananas, etc.
A details visualization can, in turn, be used as a master visualization for another details visualization, so that you can drill down deeper and deeper into your data, by marking items in a series of visualizations.
When no items are marked in the master visualizations
When you are using details visualizations in your analysis you can decide what should be shown in the details visualization when no items have been marked in its master visualizations. The example below shows how the different alternatives appear in a bar chart. Since different visualization types have different available attributes, it varies between visualization types exactly what will be shown using the different alternatives. For example, some visualizations do not display axis selectors, and others do not display scales. The help section for the Data page of the Visualization Properties describes the specifics for each visualization type.
Message on white background
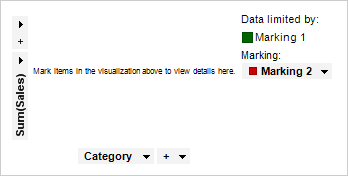
With the Message on white background option you can display a message to let anyone using the analysis know in which visualizations to mark items in order to view details. Using this option, axis selectors will also be displayed in visualizations where it is applicable.
Empty
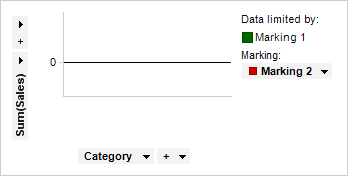
With the Empty option, the details visualization will show the axis selectors and scales, where applicable. In some visualization types, like tables and graphical tables, which do not have scales, the column headers will instead be shown using this alternative.
All Data
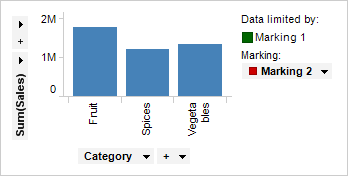
With the All Data option, the details visualization will show all the data from the master visualizations until you mark something in its master visualizations.
How to specify what to show when no items are marked in the master visualizations:
Open the Visualization Properties for the details visualization.
Go to the Data page.
Make your selection in the drop-down list If no items are marked in the master visualizations, show.
See also:
Details on Create Details Visualizations
Limiting What is Shown in Visualizations