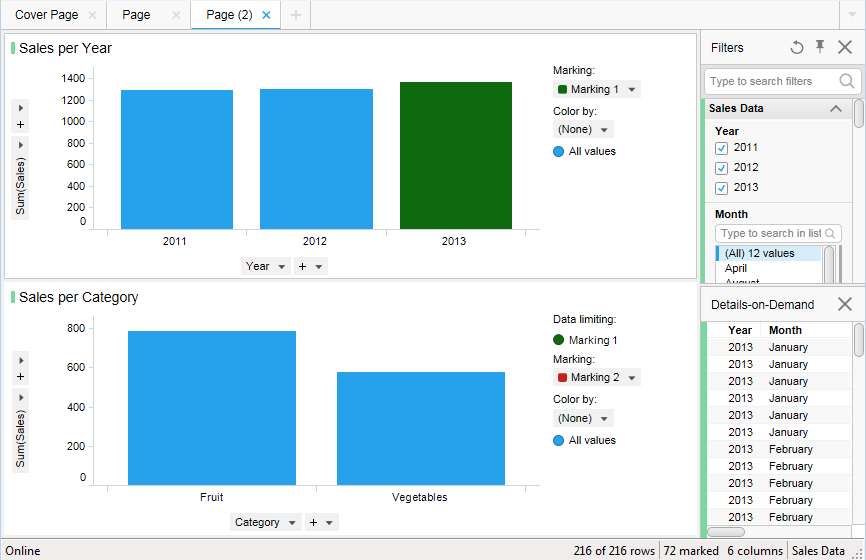
This is an example of multi-step Master-Detail visualizations. The visualizations in this example are based on the same data table and show different levels of detail. However, the visualizations could just as well be based on data from different data tables. Marking in one visualization defines the data of the next visualization, making it possible to drill down in level of detail.
Note: Related visualizations (as the Master-Detail case) can be placed on different pages in a visualization. This means that markings in a visualization that is not visible at the moment can affect the visualization that you are looking at. If a visualization is empty, it may be because it is based on markings from another visualization. Go to the master visualization and mark an item to display information in the details visualization. When creating the analysis, you can add a message explaining in which visualizations to mark items in order to view details. See What is a Details Visualization? for more information.
Note: The Details-on-Demand displays information about the marked rows from the active visualization; it could be either the master or the details visualization.
In this example the master visualization shows Sales per Year. If you mark a year, for example, 2013, in the master visualization, data will be displayed in the details visualization. This details visualization shows Sales per Category (fruit and vegetables) for 2013.
The marking of an item in the next visualization, Sales per Category, can also be setup to display an even more detailed visualization. Below, another visualization has been created where marking the category "Vegetables" in Sales per Category displays the percentage of sales per type (cucumber, lettuce and tomato) in that category for 2013.
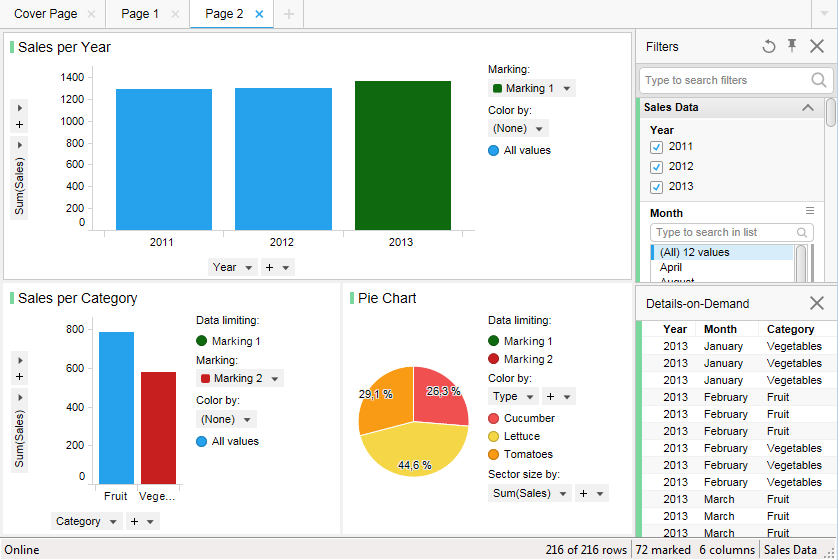
This image shows three different visualizations displaying different aspects of data from the same data table.
See also:
What is a Details Visualization?
Details on Create Details Visualization
How to Handle Multiple Related Data Tables in One Analysis