Option |
Description |
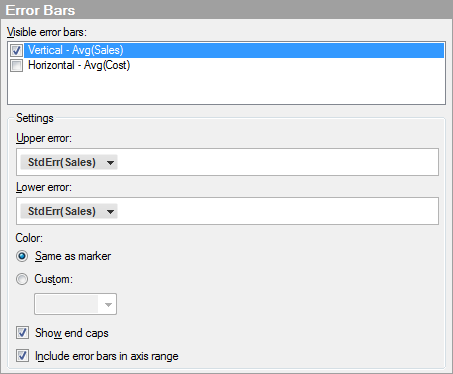
Visible
error bars |
Lists the numerical columns and measures that you can define error bars for in the visualization. If a check mark is shown in the check box, then error bars for that column or measure are visible in the visualization. Clear the check box to hide the error bars for a column or measure. Note: No error bars will be visible in the visualization until an upper or lower error has been defined. |
Settings |
Shows the settings for the selected column or measure. Note: If you use multiple Y-axes in the scatter plot you can define different error bars for the axes. However, all the defined vertical error bars will share the same settings for Color, Show end caps, and Include error bars in axis range. For example, you cannot set one vertical error bar to be blue, and another vertical error bar to be yellow in the same scatter plot. This also applies to using multiple measures on a Y-axis with a single scale. |
Upper
error |
Specifies the column and aggregation method, or custom expression to use for the upper error bars in the visualization. Note: The chosen column or measure must have numerical values. Note: For horizontal error bars in a scatter plot with non-reversed scales, the upper error refers to the error bar on the right hand side of the marker. |
Lower
error |
Specifies the column and aggregation method, or custom expression to use for the lower error bars in the visualization. Note: The chosen column or measure must have numerical values. Note: For horizontal error bars in a scatter plot with non-reversed scales, the lower error refers to the error bar on the left-hand side of the marker. |
Color |
|
Same
as marker |
Choose this option if you want an error bar to have the same color as the marker. |
Custom |
Choose this option if you want to use a custom color for the error bars. Click on the drop-down list to show the palette and select a different color. |
Show
end caps |
Specifies whether or not orthogonal lines should be displayed at the end of the error bars. |
Include
error bars in axis range |
Sets the automatic zooming so that the error bars are always visible. |
Note: The upper and lower errors refer to the underlying data. This means that if you use reversed scales in a visualization, the error bars will also be reversed. For example, for a scatter plot with reversed Y-axis, the upper error bar will be displayed below the marker. With reversed X-axis in the scatter plot, the upper error will be displayed on the left-hand side.
See also: