Option |
Description |
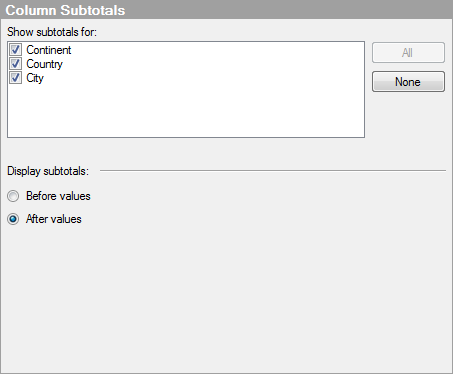
Show
subtotals for |
Lists the columns and/or hierarchies on the vertical axis of the cross table. Select the ones you wish to display subtotals for. A subtotal is a partial summarization of the values in a column and can be displayed if the vertical axis is set up as a hierarchy with at least two levels. The aggregated subtotal value is calculated using the selected aggregation measure, and is displayed for each category and at each hierarchy level. Note: The aggregated value for subtotals is not calculated on the values shown in the cross table, but on the underlying row values. For example, if "Average" is used as aggregation measure, the subtotal average of a column is calculated on the rows the column is based on and not on the values shown in the cross table. Note: Custom expressions with OVER statements should be used carefully in cross tables with subtotals. The subtotals depend on the statement the same way the cell values do, and some OVER statements may therefore result in subtotal values that seem unexpected at first glance. See OVER in Custom Expressions to learn more about using the OVER statement. |
All |
Selects all the columns in the list. Subtotals will be displayed for all the columns and/or hierarchical levels on the vertical axis of the cross table. |
None |
Deselects all the columns in the list. No subtotals will be displayed in the cross table. |
Display
subtotals |
|
Before
values |
Places the subtotal values before the cell values on each level in the hierarchy of the vertical axis. |
After
values |
Places the subtotal values after the cell values on each level in the hierarchy of the vertical axis. |
See also: