The compound annual growth rate, CAGR, is used to show the smoothed annual growth rate over a given time period. It may allow you to compare the growth rates of two investments by comparing some measure, for example revenue, production level, number of registered users, etc., during a time period.
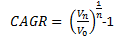
It is calculated as follows:
where
 is the
value of the current node
is the
value of the current node
 is the
value of the node to compare it with (e.g., one year back)
is the
value of the node to compare it with (e.g., one year back)
 is the
number of steps (years) between the values to compare (e.g., 1, if
you compare with the year before)
is the
number of steps (years) between the values to compare (e.g., 1, if
you compare with the year before)
Example:
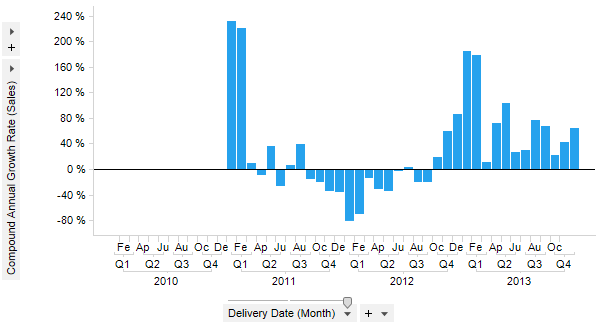
Expression:
Sum([Sales]) THEN (Real([Value] / Sum([Value]) OVER (NavigatePeriod([Axis.X],"Year",-1))) ^ (1 / ([X.Year] - First([X.Year]) OVER (NavigatePeriod([Axis.X],"Year",-1))))) - 1
The first part of the expression calculates the values to compare, i.e., the sum of sales in this example. After the THEN keyword comes first a cast to Real to make sure that the Power function (^) can be used with all column types (e.g., Currency). Then there is the calculation to be done on the nodes: the value of each node is divided by the value of the specified node to compare with (here it is set to be the corresponding node one year earlier), and this ratio is in turn raised to one through the number of years between the two nodes. And finally minus one to show it as a percentage.
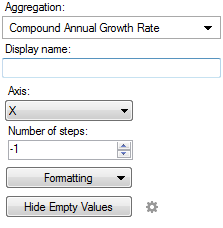
Column Selector Controls in Expanded Mode:
Option |
Description |
Aggregation |
This is where you select the Compound Annual Growth Rate aggregation. |
Display name |
Allows you to specify a different display name, instead of the default "Compound Annual Growth Rate ([Column Name])". |
Axis |
Allows you to specify the axis over which to calculate the nodes. Only categorical axes that perform some kind of grouping can show up in the drop-down list. This means that if you only have a grouping on the X-axis then this is the only axis available, whereas if you also have colored by a categorical column then the Color axis will be available as well, and so on. |
Number of steps |
Defines the number of steps between the nodes to compare. If the number of steps is -1 then the difference will be calculated between the current node and the one before it. If the number of steps is 1 then the difference will be calculated for the current node and the one following it. |
Formatting |
Allows you to change the formatting of the axis. For example, change to Percentage to show the values in percent rather than as decimal numbers. |
Hide Empty Values |
Creates
a Show/Hide
Items rule that hides all empty values. Click on the properties
symbol, |
See also:
Using Expressions on Aggregated Data (the THEN Keyword)
 , to go to the Show/Hide Items page
of the Visualization Properties dialog to edit or remove the rule.
, to go to the Show/Hide Items page
of the Visualization Properties dialog to edit or remove the rule.