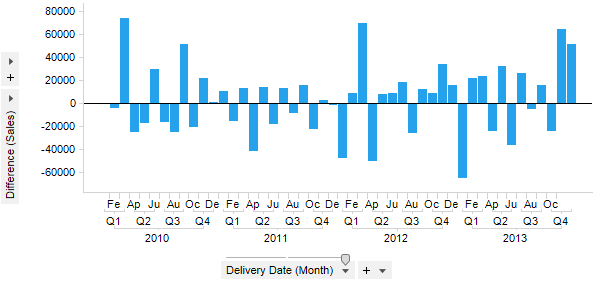
Used to calculate the difference between two specified nodes. You can specify the axis to work on, the level of the hierarchy (0 means the leaf node) and the number of steps between the nodes to compare.
Example:
Expression:
Sum([Sales]) THEN [Value] - First([Value]) OVER (NavigatePeriod([Axis.X],0,-1))
The first part of the expression calculates the values to compare, i.e., the sum of sales in this example. After the THEN keyword comes the comparison between the nodes: each node gets subtracted by the node specified by the settings (in this case the preceding node since the number of steps is set to -1). The aggregation First() is just used since an aggregation is needed before the OVER keyword. It will take you to the first value of the node to subtract, but since each node only has one value then this aggregation is basically irrelevant.
Column Selector Controls in Expanded Mode:
Option |
Description |
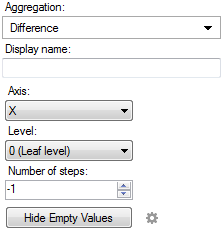
Aggregation |
This is where you select the Difference aggregation. |
Display name |
Allows you to specify a different display name, instead of the default "Difference ([Column Name])". |
Axis |
Allows you to specify the axis over which to calculate the nodes. Only categorical axes that perform some kind of grouping can show up in the drop-down list. This means that if you only have a grouping on the X-axis then this is the only axis available, whereas if you also have colored by a categorical column then the Color axis will be available as well, and so on. |
Level |
Defines the hierarchy level to compare values at. You can either specify a named level such as "Year", "Quarter" or "Month", or, you can set a number which moves you up or down in the currently set hierarchy on the selected axis. If the level is 0 you will always compare the current leaf level, even if you change it in the visualization, for example, using a hierarchy slider. If the level is set to "Year", then you are in fact doing a Difference Year over Year calculation, and the aggregation selector will change correspondingly. |
Number of steps |
Defines the number of steps between the nodes to compare. If the number of steps is -1 then the difference will be calculated between the current node and the one before it. If the number of steps is 1 then the difference will be calculated for the current node and the one following it. |
Hide Empty Values |
Creates
a Show/Hide
Items rule that hides all empty values. Click on the properties
symbol, |
See also:
Using Expressions on Aggregated Data (the THEN Keyword)
 , to go to the Show/Hide Items page
of the Visualization Properties dialog to edit or remove the rule.
, to go to the Show/Hide Items page
of the Visualization Properties dialog to edit or remove the rule.