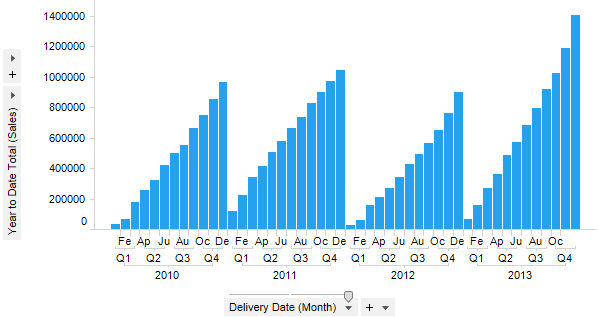
Used to show the cumulative sum within each year. This aggregation is only applicable when you are having a time hierarchy including year on the X-axis.
Example:
Expression:
Sum([Sales]) THEN Sum([Value]) OVER (Intersect(AllPrevious([Axis.X]),NavigatePeriod([Axis.X],"Year",0,0)))
The first part of the expression calculates the values to compare, i.e., the sum of sales in this example. After the THEN keyword comes the calculation to be done on the selected nodes: the sum of all previous nodes; the Intersect method makes sure it is calculated within each year only and not on all data.
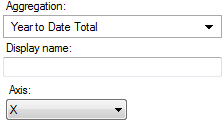
Column Selector Controls in Expanded Mode:
Option |
Description |
Aggregation |
This is where you select the Year to Date Total aggregation. |
Display name |
Allows you to specify a different display name, instead of the default "Year to Date Total ([Column Name])". |
Axis |
Allows you to specify the axis over which to calculate the nodes. Only categorical axes that perform some kind of grouping can show up in the drop-down list. This means that if you only have a grouping on the X-axis then this is the only axis available, whereas if you also have colored by a categorical column then the Color axis will be available as well, and so on. |
See also:
Using Expressions on Aggregated Data (the THEN Keyword