Position the mouse pointer between the visualizations you want to resize.
Response: The mouse pointer changes appearance to
![]() .
.
Click and drag the mouse to resize the visualizations.
You can insert several visualizations on a page. Each new visualization will be inserted at the top of the page.
Often you will want to adjust the layout of the visualizations, as you might want some to be larger than others, or some visualization to be placed beside another instead of above it.
To resize visualizations:
Position the mouse pointer between the visualizations you want to resize.
Response: The mouse pointer changes appearance to
![]() .
.
Click and drag the mouse to resize the visualizations.
Note: If the visualization becomes too small in either direction, controls such as the legend, zoom sliders, axis selectors, etc., are hidden and cannot be viewed until the size of the visualization is increased.
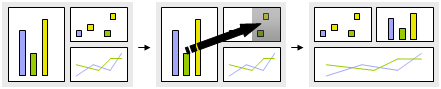
You can also change the layout of the visualizations using a drag-and-drop operation. Click on a visualization title and drag the mouse over another visualization. A shaded box will appear over a part of that visualization, and when you release the mouse the layout will be updated as shown below.
To place a visualization beside another:
Click on the title of the bar chart and drag it onto the scatter plot. Drag it to the right side of the scatter plot and a shaded area will indicate that by dropping the bar chart, it will be placed to the right of the scatter plot. Release the mouse, and the bar chart will be placed to the right of the scatter plot. All the visualizations will automatically adjust to fill the entire window.
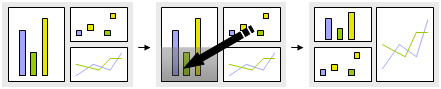
To place a visualization below another:
Click on the title of the scatter plot and drag it onto the bar chart. Drag it to the bottom part of the bar chart and a shaded area will indicate that by dropping the scatter plot, it will be placed below the bar chart. Release the mouse, and the scatter plot will be placed below the bar chart. All the visualizations will automatically adjust to fill the entire window.
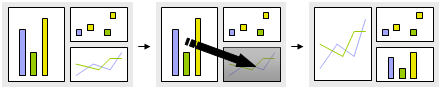
Click on the title of the bar chart and drag it onto the line chart. Drag it to the center of the line chart and a shaded area will cover the entire line chart, indicating that by dropping the bar chart, the visualizations will switch places. Release the mouse, and the visualizations will switch places. The window layout will stay the same since the switched visualizations take each other's size and position.
Tip: If the title bar of a visualization has been hidden, it can be shown by right-clicking on the visualization and selecting Properties. On the General page, select the Show title bar check box.
See also: